106 E Curtis St Mount Vernon, OH 43050
Estimated Value: $163,000 - $264,000
3
Beds
2
Baths
1,934
Sq Ft
$118/Sq Ft
Est. Value
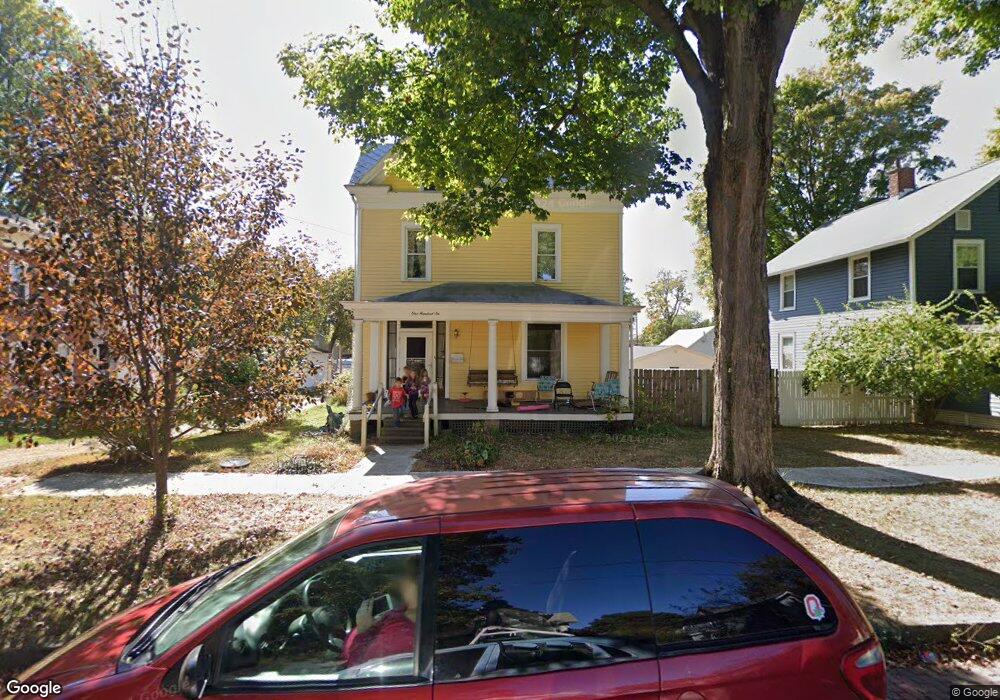
About This Home
This home is located at 106 E Curtis St, Mount Vernon, OH 43050 and is currently estimated at $228,365, approximately $118 per square foot. 106 E Curtis St is a home located in Knox County with nearby schools including Mount Vernon High School, St. Vincent de Paul School, and Christian Star Academy.
Ownership History
Date
Name
Owned For
Owner Type
Purchase Details
Closed on
Jul 13, 2023
Sold by
Shareth Investments Llc
Bought by
Hochstedler Home Improvements Llc
Current Estimated Value
Purchase Details
Closed on
May 26, 2023
Sold by
Gardner Dennis
Bought by
Shareth Investments Llc
Purchase Details
Closed on
May 1, 2023
Sold by
Gill David B
Bought by
Gardner Dennis and Gardner Jennifer
Purchase Details
Closed on
Dec 2, 2020
Sold by
Gill Charles S H
Bought by
Charles S H Gill and David B Jr;Mcbride Roberta; Handshey Joh
Purchase Details
Closed on
Nov 10, 2020
Sold by
Gill Charles S H
Bought by
Charles S H Gill and David B Jr;Mcbride Roberta;Handshey Eliz
Purchase Details
Closed on
Oct 7, 2020
Sold by
Gill Charles S H
Bought by
Charles S H Gill and B;Mcbride Roberta;Ha David
Purchase Details
Closed on
Dec 21, 1990
Sold by
Gill Aileen B
Bought by
Gill Charles S H and Gill David B
Create a Home Valuation Report for This Property
The Home Valuation Report is an in-depth analysis detailing your home's value as well as a comparison with similar homes in the area
Home Values in the Area
Average Home Value in this Area
Purchase History
| Date | Buyer | Sale Price | Title Company |
|---|---|---|---|
| Hochstedler Home Improvements Llc | $125,000 | None Listed On Document | |
| Shareth Investments Llc | -- | None Listed On Document | |
| Gardner Dennis | $73,500 | None Listed On Document | |
| Charles S H Gill | -- | -- | |
| Charles S H Gill | -- | -- | |
| Charles S H Gill | -- | -- | |
| Gill Charles S H | -- | -- |
Source: Public Records
Tax History
| Year | Tax Paid | Tax Assessment Tax Assessment Total Assessment is a certain percentage of the fair market value that is determined by local assessors to be the total taxable value of land and additions on the property. | Land | Improvement |
|---|---|---|---|---|
| 2024 | $2,091 | $54,050 | $9,800 | $44,250 |
| 2023 | $2,138 | $54,050 | $9,800 | $44,250 |
| 2022 | $1,911 | $38,060 | $6,900 | $31,160 |
| 2021 | $1,654 | $38,060 | $6,900 | $31,160 |
| 2020 | $1,611 | $38,060 | $6,900 | $31,160 |
| 2019 | $1,412 | $32,440 | $7,460 | $24,980 |
| 2018 | $1,477 | $32,440 | $7,460 | $24,980 |
| 2017 | $1,496 | $32,440 | $7,460 | $24,980 |
| 2016 | $1,403 | $30,030 | $6,900 | $23,130 |
| 2015 | $1,354 | $30,030 | $6,900 | $23,130 |
| 2014 | $1,360 | $30,030 | $6,900 | $23,130 |
| 2013 | $1,430 | $30,040 | $5,440 | $24,600 |
Source: Public Records
Map
Nearby Homes
- 608 N Gay St
- 107 E Lamartine St
- 607 N Mulberry St
- 304 N Gay St
- 403 N Mulberry St
- 6 Elliott St
- 208 E Burgess St
- 12 Third Ave
- 12 3rd Ave
- 0 W Pleasant St
- 301 Locust St
- 612 N Clinton St
- 305 Cooper St
- 104 N Park St
- 419 E Pleasant St
- 418 E Pleasant St
- 213 Coshocton Ave
- 220 Coshocton Ave
- 102 E Gambier St
- 22 E Gamber St
- 106 E Curtis St
- 104 E Curtis St
- 108 E Curtis St
- 110 E Curtis St
- 606 N Gay St
- 604 N Gay St
- 105 E Lamartine St
- 105 E Lamartine St
- 107 E Curtis St
- 105 E Curtis St
- 109 E Curtis St
- 602 N Gay St
- 112 E Curtis St
- 111 E Lamartine St
- 111 E Curtis St
- 700 N Gay St
- 113 E Lamartine St
- 600 N Gay St
- 114 E Curtis St
- 702 N Gay St
Your Personal Tour Guide
Ask me questions while you tour the home.