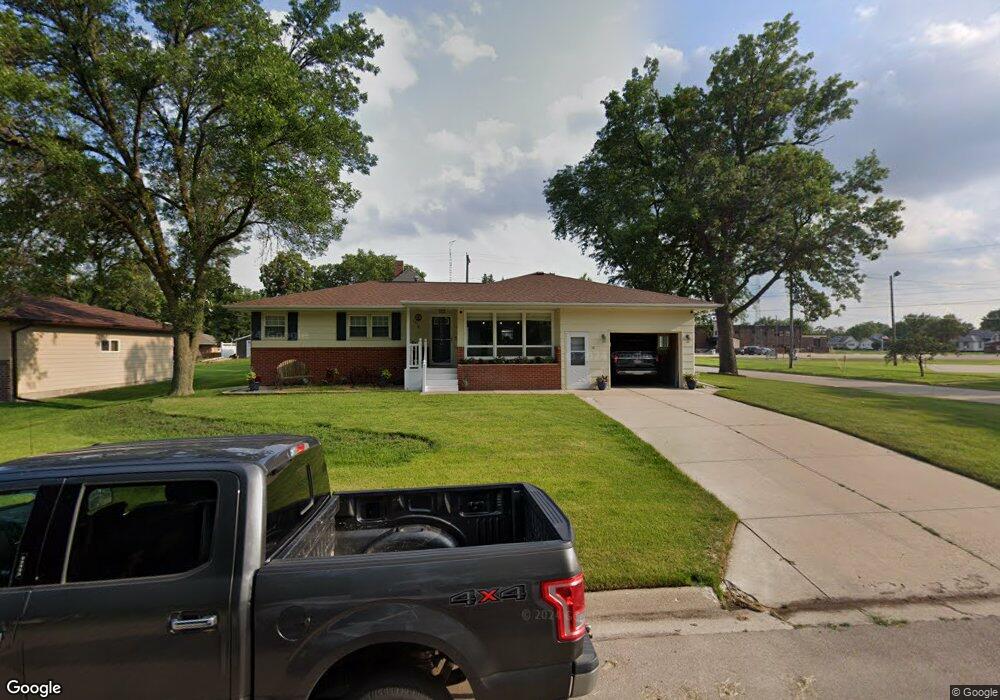
106 E Elkhorn St Pierce, NE 68767
Estimated Value: $229,000 - $299,000
3
Beds
2
Baths
1,625
Sq Ft
$162/Sq Ft
Est. Value
About This Home
This home is located at 106 E Elkhorn St, Pierce, NE 68767 and is currently estimated at $263,377, approximately $162 per square foot. 106 E Elkhorn St is a home located in Pierce County with nearby schools including Pierce Elementary School, Pierce Junior/Senior High School, and Zion Lutheran School.
Ownership History
Date
Name
Owned For
Owner Type
Purchase Details
Closed on
Aug 5, 2016
Sold by
Brookhouser William H and Brookhouser Lisa N
Bought by
Zubrod Jason and Zubrod Sonia
Current Estimated Value
Home Financials for this Owner
Home Financials are based on the most recent Mortgage that was taken out on this home.
Original Mortgage
$140,000
Outstanding Balance
$111,096
Interest Rate
3.48%
Mortgage Type
Future Advance Clause Open End Mortgage
Estimated Equity
$152,281
Purchase Details
Closed on
Jun 15, 2012
Sold by
Shimerka Letha J and Shimerka Dave L
Bought by
Brookhouser William H and Brookhouser Lisa N
Home Financials for this Owner
Home Financials are based on the most recent Mortgage that was taken out on this home.
Original Mortgage
$132,554
Interest Rate
3.75%
Mortgage Type
FHA
Purchase Details
Closed on
Jan 30, 2012
Sold by
Shimerka Letha J
Bought by
Shimerka David L and Hedrick Linda J
Create a Home Valuation Report for This Property
The Home Valuation Report is an in-depth analysis detailing your home's value as well as a comparison with similar homes in the area
Purchase History
| Date | Buyer | Sale Price | Title Company |
|---|---|---|---|
| Zubrod Jason | $165,000 | American Title & Escrow Co | |
| Brookhouser William H | $135,000 | None Available | |
| Shimerka David L | -- | None Available |
Source: Public Records
Mortgage History
| Date | Status | Borrower | Loan Amount |
|---|---|---|---|
| Open | Zubrod Jason | $140,000 | |
| Previous Owner | Brookhouser William H | $132,554 |
Source: Public Records
Tax History
| Year | Tax Paid | Tax Assessment Tax Assessment Total Assessment is a certain percentage of the fair market value that is determined by local assessors to be the total taxable value of land and additions on the property. | Land | Improvement |
|---|---|---|---|---|
| 2025 | $2,931 | $221,570 | $21,825 | $199,745 |
| 2024 | $2,682 | $221,570 | $21,825 | $199,745 |
| 2023 | $4,373 | $256,995 | $13,640 | $243,355 |
| 2022 | $3,992 | $217,435 | $13,640 | $203,795 |
| 2021 | $3,306 | $191,635 | $13,640 | $177,995 |
| 2020 | $3,022 | $178,895 | $13,640 | $165,255 |
| 2019 | $2,763 | $167,100 | $13,640 | $153,460 |
| 2018 | $2,555 | $162,225 | $13,640 | $148,585 |
| 2017 | $2,649 | $162,225 | $13,640 | $148,585 |
| 2016 | $2,603 | $138,020 | $8,185 | $129,835 |
| 2015 | $2,349 | $121,770 | $8,185 | $113,585 |
| 2014 | $2,443 | $121,770 | $8,185 | $113,585 |
Source: Public Records
Map
Nearby Homes
- 85281 Nebraska 13
- 85222 E Deer Run
- 85164 Starkel Rd
- 85175 Starkel Rd
- 85162 Starkel Rd
- 85170 Starkel Rd
- 54916 W Willow St
- 549th Ave Hwy 13
- 17.51 Acres 853rd Rd
- RR Pierce
- 85232 E Deer Run
- 4.5 Acres 552nd Ave
- 85012 545th Ave
- 55540 853rd Rd
- 0000 856th Rd
- 31 25 1 PT W 1 2 N 1 2 Ne 1 4 40 08 Ac 31-25-1
- 0 Rodeo Dr
- Lot 22 Rodeo Dr
- 542 Nebraska 13
- 0000 850 Rd
- 112 E Elkhorn St
- 105 E Pierce St
- 107 E Elkhorn St
- 319 N 2nd St
- 119 E Pierce St
- 113 E Elkhorn St
- 403 N Brown St
- 121 E Elkhorn St
- 318 N 2nd St
- 416 N Brown St
- 413 N Brown St
- 220 N Brown St
- 110 E Pierce St
- 326 N 2nd St
- 122 E Pierce St
- 402 N 2nd St
- 121 W Elkhorn St
- 203 E Pierce St
- 420 N Brown St
- 419 N Brown St Unit 421
Your Personal Tour Guide
Ask me questions while you tour the home.