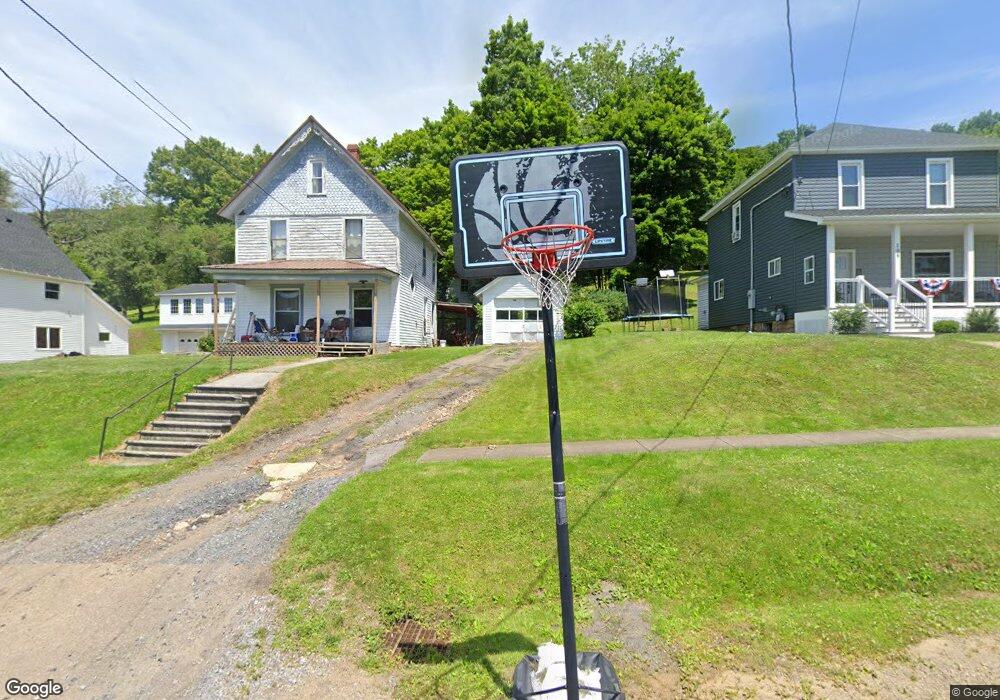
106 E Green St Smethport, PA 16749
Estimated Value: $76,773 - $188,000
--
Bed
--
Bath
1,445
Sq Ft
$81/Sq Ft
Est. Value
About This Home
This home is located at 106 E Green St, Smethport, PA 16749 and is currently estimated at $116,443, approximately $80 per square foot. 106 E Green St is a home located in McKean County with nearby schools including Smethport Area Elementary School and Smethport Area Junior/Senior High School.
Ownership History
Date
Name
Owned For
Owner Type
Purchase Details
Closed on
Mar 2, 2021
Sold by
Babcock Jamie L
Bought by
Spaich Sherri L
Current Estimated Value
Home Financials for this Owner
Home Financials are based on the most recent Mortgage that was taken out on this home.
Original Mortgage
$34,000
Outstanding Balance
$25,201
Interest Rate
2.7%
Mortgage Type
Future Advance Clause Open End Mortgage
Estimated Equity
$91,242
Purchase Details
Closed on
May 21, 2019
Sold by
Hamlin Bank And Trust Company
Bought by
Babcock Jamie L
Home Financials for this Owner
Home Financials are based on the most recent Mortgage that was taken out on this home.
Original Mortgage
$28,000
Interest Rate
4%
Mortgage Type
Commercial
Purchase Details
Closed on
Oct 5, 2018
Sold by
Neill Gregory S
Bought by
Hamlin Bank And Trust Company
Create a Home Valuation Report for This Property
The Home Valuation Report is an in-depth analysis detailing your home's value as well as a comparison with similar homes in the area
Home Values in the Area
Average Home Value in this Area
Purchase History
| Date | Buyer | Sale Price | Title Company |
|---|---|---|---|
| Spaich Sherri L | -- | None Available | |
| Babcock Jamie L | $25,000 | None Available | |
| Hamlin Bank And Trust Company | $8,029 | None Available |
Source: Public Records
Mortgage History
| Date | Status | Borrower | Loan Amount |
|---|---|---|---|
| Open | Spaich Sherri L | $34,000 | |
| Previous Owner | Babcock Jamie L | $28,000 |
Source: Public Records
Tax History Compared to Growth
Tax History
| Year | Tax Paid | Tax Assessment Tax Assessment Total Assessment is a certain percentage of the fair market value that is determined by local assessors to be the total taxable value of land and additions on the property. | Land | Improvement |
|---|---|---|---|---|
| 2025 | $1,188 | $34,660 | $5,340 | $29,320 |
| 2024 | $1,145 | $34,660 | $5,340 | $29,320 |
| 2023 | $1,145 | $34,660 | $5,340 | $29,320 |
| 2022 | $1,145 | $34,660 | $5,340 | $29,320 |
| 2021 | $1,130 | $34,660 | $5,340 | $29,320 |
| 2020 | $1,130 | $34,660 | $5,340 | $29,320 |
| 2019 | $1,074 | $34,660 | $5,340 | $29,320 |
| 2018 | $11 | $34,660 | $5,340 | $29,320 |
| 2017 | -- | $34,660 | $5,340 | $29,320 |
| 2016 | $966 | $34,660 | $5,340 | $29,320 |
| 2015 | $341 | $34,660 | $5,340 | $29,320 |
| 2014 | $341 | $34,660 | $5,340 | $29,320 |
Source: Public Records
Map
Nearby Homes
- 402 E Water St
- 501 Allegheny St
- 225 Emerald Isle
- 108 Library Dr
- 314 Emerald Isle
- 308 Emerald Isle
- 305 State St
- 19 W Willow St
- 712 W Main St
- 41 Bank St
- 911 W Main St
- 00 W Main St
- 18398 Route 6
- 18398 U S 6
- 6113 Route 46
- 0 Rte 59 Smethport Ormsby Rd Unit 24-264
- 198 Spring Run Rd
- 3488 Pennsylvania 46
- 3488 Route 46
- 179 White Hollow Rd