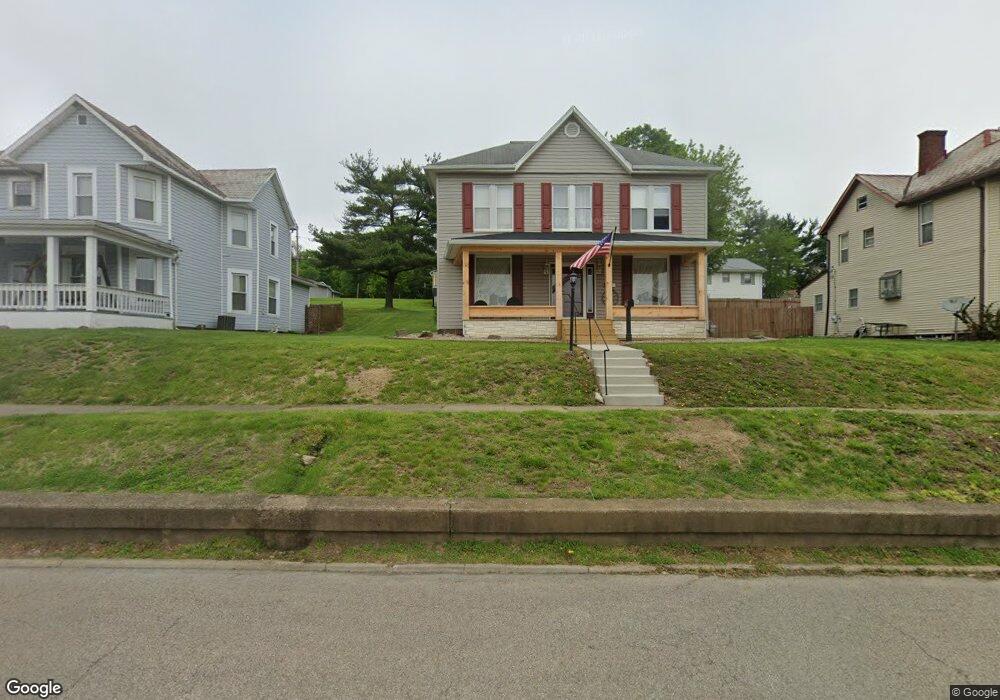
106 E Main St New Concord, OH 43762
Estimated Value: $177,000 - $248,778
3
Beds
2
Baths
1,792
Sq Ft
$126/Sq Ft
Est. Value
About This Home
This home is located at 106 E Main St, New Concord, OH 43762 and is currently estimated at $225,945, approximately $126 per square foot. 106 E Main St is a home located in Muskingum County with nearby schools including New Concord Elementary School, Larry Miller Intermediate Elementary School, and East Muskingum Middle School.
Ownership History
Date
Name
Owned For
Owner Type
Purchase Details
Closed on
Sep 11, 2024
Sold by
Burrows David Reith
Bought by
David Burrows Revocable Trust and Burrows
Current Estimated Value
Purchase Details
Closed on
Feb 19, 2009
Sold by
Wyatt Kimberly J
Bought by
Burrows David R
Home Financials for this Owner
Home Financials are based on the most recent Mortgage that was taken out on this home.
Original Mortgage
$50,000
Interest Rate
5.06%
Mortgage Type
New Conventional
Purchase Details
Closed on
Aug 21, 2002
Sold by
Conrad Linda
Bought by
Burrows David R and Wyatt Kimberly J
Home Financials for this Owner
Home Financials are based on the most recent Mortgage that was taken out on this home.
Original Mortgage
$53,500
Interest Rate
6.63%
Mortgage Type
New Conventional
Create a Home Valuation Report for This Property
The Home Valuation Report is an in-depth analysis detailing your home's value as well as a comparison with similar homes in the area
Home Values in the Area
Average Home Value in this Area
Purchase History
| Date | Buyer | Sale Price | Title Company |
|---|---|---|---|
| David Burrows Revocable Trust | -- | None Listed On Document | |
| Burrows David R | -- | Attorney | |
| Burrows David R | $103,500 | -- |
Source: Public Records
Mortgage History
| Date | Status | Borrower | Loan Amount |
|---|---|---|---|
| Previous Owner | Burrows David R | $50,000 | |
| Previous Owner | Burrows David R | $53,500 |
Source: Public Records
Tax History
| Year | Tax Paid | Tax Assessment Tax Assessment Total Assessment is a certain percentage of the fair market value that is determined by local assessors to be the total taxable value of land and additions on the property. | Land | Improvement |
|---|---|---|---|---|
| 2024 | $2,175 | $62,160 | $5,775 | $56,385 |
| 2023 | $1,786 | $47,180 | $4,865 | $42,315 |
| 2022 | $1,752 | $47,180 | $4,865 | $42,315 |
| 2021 | $1,732 | $47,180 | $4,865 | $42,315 |
| 2020 | $1,777 | $47,180 | $4,865 | $42,315 |
| 2019 | $1,742 | $47,180 | $4,865 | $42,315 |
| 2018 | $1,666 | $47,180 | $4,865 | $42,315 |
| 2017 | $1,531 | $39,025 | $4,865 | $34,160 |
| 2016 | $1,533 | $39,030 | $4,870 | $34,160 |
| 2015 | $1,554 | $39,030 | $4,870 | $34,160 |
| 2013 | $1,659 | $39,030 | $4,870 | $34,160 |
Source: Public Records
Map
Nearby Homes
- 110 Cherry Ln
- 67 E Main St
- 1420 Glenn Hwy
- 112 Thompson Ave
- 160 N Liberty St
- 170 Thompson Ave
- 0 Maple Ln
- 0 Rix Mills Rd
- 60999 Greenbriar Dr
- 0 Homestead Dr Unit 11611647
- 0 Homestead Dr Unit 5174212
- 61220 Kadon Dr
- 60040 Bliss Rd
- 62132 Beech Circle Rd
- 3029 Best Rd
- 135 S Moose Eye Rd
- 3278 Rough & Ready Rd
- 101 N Sundale Rd
- 10050 Norwich Dr
- 100 Linvale Dr
Your Personal Tour Guide
Ask me questions while you tour the home.