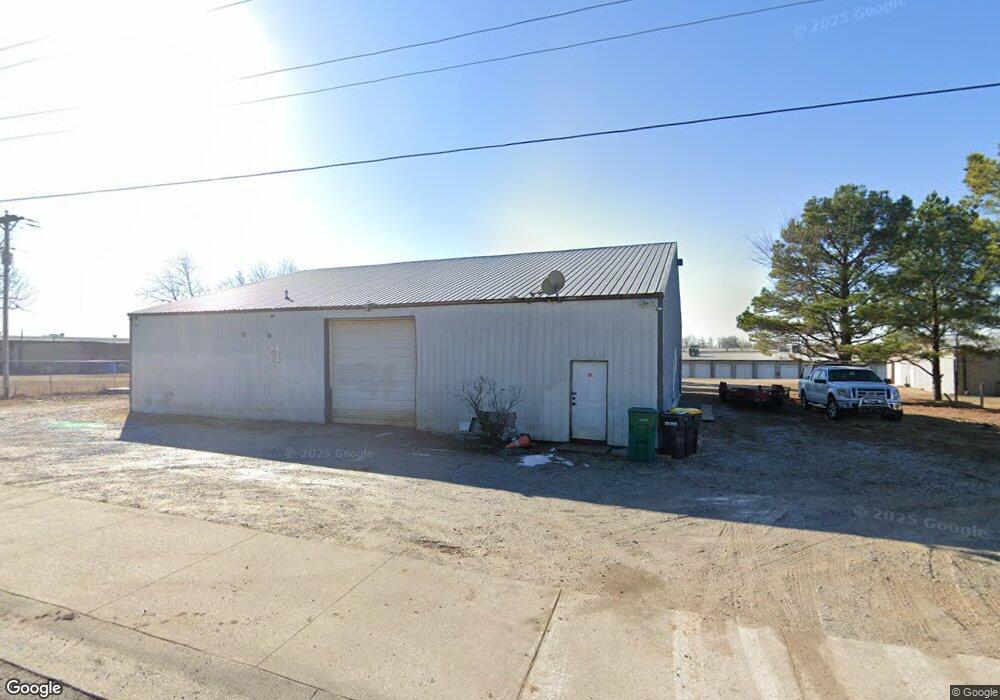
106 E Nursery Rd Rogers, AR 72758
--
Bed
--
Bath
3,840
Sq Ft
1.2
Acres
About This Home
This home is located at 106 E Nursery Rd, Rogers, AR 72758. 106 E Nursery Rd is a home located in Benton County with nearby schools including Jones Elementary School, Kirksey Middle School, and Rogers High School.
Ownership History
Date
Name
Owned For
Owner Type
Purchase Details
Closed on
Jan 30, 2014
Sold by
Jeannie Fleeman Grantor Retained Annuity
Bought by
Fleeman Jeannie
Purchase Details
Closed on
Jan 1, 2014
Sold by
Fleeman Jeannie
Bought by
Dynamic Development Inc
Purchase Details
Closed on
Aug 18, 2006
Sold by
Fleeman Jeannie
Bought by
The Fleeman Family Lp I
Purchase Details
Closed on
Jan 24, 2003
Bought by
Fleeman Ptnrshp
Purchase Details
Closed on
Mar 16, 2002
Bought by
Fleeman Rev Trust
Purchase Details
Closed on
May 1, 1999
Bought by
Dod 05-01-1999
Purchase Details
Closed on
Jan 13, 1999
Bought by
Fleeman Tr
Purchase Details
Closed on
Oct 20, 1993
Bought by
Fleeman
Purchase Details
Closed on
Oct 4, 1993
Bought by
Bass
Purchase Details
Closed on
Aug 3, 1993
Bought by
Bass
Purchase Details
Closed on
Feb 26, 1988
Bought by
Bass
Purchase Details
Closed on
Jun 22, 1987
Bought by
Martin
Purchase Details
Closed on
Jul 7, 1986
Bought by
Hallmark
Create a Home Valuation Report for This Property
The Home Valuation Report is an in-depth analysis detailing your home's value as well as a comparison with similar homes in the area
Home Values in the Area
Average Home Value in this Area
Purchase History
| Date | Buyer | Sale Price | Title Company |
|---|---|---|---|
| Fleeman Jeannie | -- | None Available | |
| Dynamic Development Inc | -- | None Available | |
| The Jeannie Leeman Grantor Retained Annu | -- | None Available | |
| The Fleeman Family Lp I | -- | None Available | |
| Fleeman Ptnrshp | -- | -- | |
| Fleeman Rev Trust | -- | -- | |
| Dod 05-01-1999 | -- | -- | |
| Fleeman Tr | -- | -- | |
| Fleeman | $45,000 | -- | |
| Bass | -- | -- | |
| Bass | -- | -- | |
| Bass | -- | -- | |
| Bass | -- | -- | |
| Martin | $38,000 | -- | |
| Hallmark | -- | -- |
Source: Public Records
Tax History Compared to Growth
Tax History
| Year | Tax Paid | Tax Assessment Tax Assessment Total Assessment is a certain percentage of the fair market value that is determined by local assessors to be the total taxable value of land and additions on the property. | Land | Improvement |
|---|---|---|---|---|
| 2025 | $2,192 | $53,566 | $34,500 | $19,066 |
| 2024 | $1,960 | $53,566 | $34,500 | $19,066 |
| 2023 | $1,782 | $33,690 | $22,270 | $11,420 |
| 2022 | $1,853 | $33,690 | $22,270 | $11,420 |
| 2021 | $1,848 | $33,690 | $22,270 | $11,420 |
| 2020 | $2,092 | $38,110 | $24,880 | $13,230 |
| 2019 | $2,092 | $38,110 | $24,880 | $13,230 |
| 2018 | $2,092 | $38,110 | $24,880 | $13,230 |
| 2017 | $2,111 | $38,110 | $24,880 | $13,230 |
| 2016 | $1,978 | $38,110 | $24,880 | $13,230 |
| 2015 | $2,050 | $38,760 | $25,090 | $13,670 |
| 2014 | $2,050 | $38,760 | $25,090 | $13,670 |
Source: Public Records
Map
Nearby Homes
- 407 E Mccann Rd
- 122 E Glendale Ln
- 9.02 Acres W Dyke Rd
- 2911 S D St
- 2006 S E Place
- 3108 & 3110 S B St
- 2221 S 9th St
- 906 W Geneva St
- 3105 & 3107 S E St
- 2711 Aspen Ln
- 1904 S 8th St
- 2717 Aspen Ln
- 834 Mccann Rd
- Tract 3 Pinewoods Dr
- 1809 S G St
- 812 E Linden St
- 2006 S 11th St
- 0 Hwy 94 Dr Unit 1239629
- 3210 S 3rd St
- 1100 W Banz Rd
- 45 1st Str S & Nursery
- 28 W Nursery Rd
- 25 W Nursery Rd
- 2809 S 1st St
- 2802 Rt 1
- 2710 Rt 1 Box 134 A
- 2743 S 1st St
- 2705 S 1st St
- 2813 S 1st St
- 2501 S 1st St
- 233 W Nursery Rd
- 410 E Nursery Rd
- 414 E Nursery Rd
- 2815 S 1st St
- 407 E Nursery Rd
- 2308 S B St
- 2306 S B St
- 2922 S 1st St
- 2201 S 1st St
- 2304 S B St