3
Beds
1
Bath
1,314
Sq Ft
5,968
Sq Ft Lot
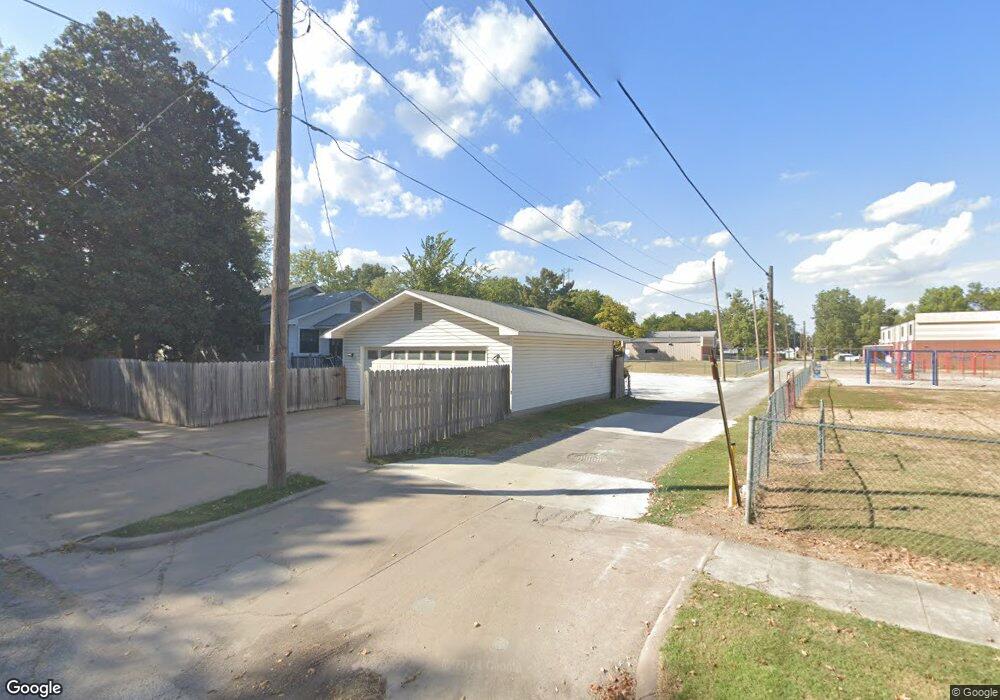
About This Home
This home is located at 106 F St NE, Miami, OK 74354. 106 F St NE is a home located in Ottawa County with nearby schools including Miami High School and Mt. Olive Lutheran School.
Ownership History
Date
Name
Owned For
Owner Type
Purchase Details
Closed on
Feb 20, 2018
Sold by
Board Of County Commissioners For Ottawa
Bought by
Miami Public Schools
Purchase Details
Closed on
Apr 19, 2010
Sold by
Neely Stephen G
Bought by
Berg Charles L
Home Financials for this Owner
Home Financials are based on the most recent Mortgage that was taken out on this home.
Original Mortgage
$3,000
Interest Rate
4.9%
Mortgage Type
Purchase Money Mortgage
Purchase Details
Closed on
Jul 6, 2007
Sold by
Neely Stephen Gregory
Bought by
Smith Linda K
Home Financials for this Owner
Home Financials are based on the most recent Mortgage that was taken out on this home.
Original Mortgage
$14,090
Interest Rate
6.41%
Mortgage Type
Purchase Money Mortgage
Create a Home Valuation Report for This Property
The Home Valuation Report is an in-depth analysis detailing your home's value as well as a comparison with similar homes in the area
Home Values in the Area
Average Home Value in this Area
Purchase History
| Date | Buyer | Sale Price | Title Company |
|---|---|---|---|
| Miami Public Schools | -- | None Available | |
| Berg Charles L | $3,000 | None Available | |
| Smith Linda K | $14,000 | None Available |
Source: Public Records
Mortgage History
| Date | Status | Borrower | Loan Amount |
|---|---|---|---|
| Previous Owner | Berg Charles L | $3,000 | |
| Previous Owner | Smith Linda K | $14,090 |
Source: Public Records
Tax History Compared to Growth
Tax History
| Year | Tax Paid | Tax Assessment Tax Assessment Total Assessment is a certain percentage of the fair market value that is determined by local assessors to be the total taxable value of land and additions on the property. | Land | Improvement |
|---|---|---|---|---|
| 2024 | -- | $0 | $0 | $0 |
| 2023 | $0 | $0 | $0 | $0 |
| 2022 | $0 | $0 | $0 | $0 |
| 2021 | $0 | $0 | $0 | $0 |
| 2020 | $0 | $0 | $0 | $0 |
| 2019 | $34 | $0 | $0 | $0 |
| 2018 | $0 | $0 | $0 | $0 |
| 2017 | $0 | $0 | $0 | $0 |
| 2016 | $34 | $377 | $342 | $35 |
| 2015 | $154 | $1,730 | $310 | $1,420 |
| 2014 | $137 | $1,674 | $342 | $1,332 |
Source: Public Records
Map
Nearby Homes