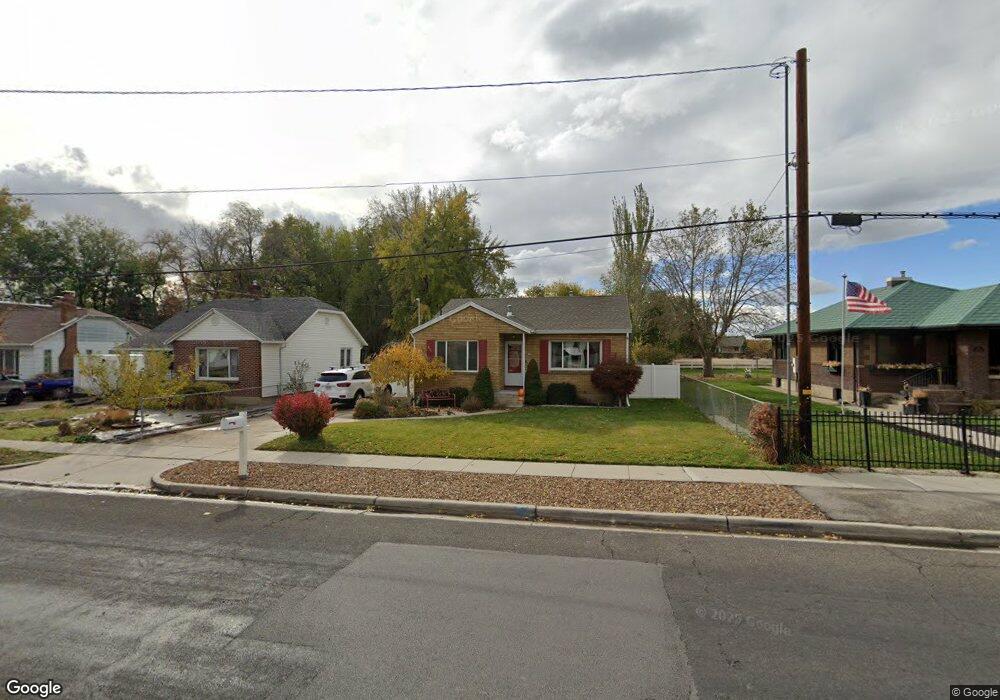
106 Flint St Layton, UT 84041
Estimated Value: $365,000 - $423,200
3
Beds
2
Baths
1,956
Sq Ft
$202/Sq Ft
Est. Value
About This Home
This home is located at 106 Flint St, Layton, UT 84041 and is currently estimated at $395,050, approximately $201 per square foot. 106 Flint St is a home located in Davis County with nearby schools including Layton Elementary School, Fairfield Junior High School, and Layton High School.
Ownership History
Date
Name
Owned For
Owner Type
Purchase Details
Closed on
Apr 26, 2014
Sold by
Heaston Adam G and Heaston Sunnie L
Bought by
Christensen Travis and Christensen Jessica
Current Estimated Value
Home Financials for this Owner
Home Financials are based on the most recent Mortgage that was taken out on this home.
Original Mortgage
$150,100
Outstanding Balance
$113,629
Interest Rate
4.23%
Mortgage Type
New Conventional
Estimated Equity
$281,421
Purchase Details
Closed on
Nov 12, 2009
Sold by
Simmons Robert Dean and Simmons Lorlee V
Bought by
Heaston Adam G and Heaston Sunnie L
Home Financials for this Owner
Home Financials are based on the most recent Mortgage that was taken out on this home.
Original Mortgage
$144,337
Interest Rate
4.92%
Mortgage Type
FHA
Create a Home Valuation Report for This Property
The Home Valuation Report is an in-depth analysis detailing your home's value as well as a comparison with similar homes in the area
Home Values in the Area
Average Home Value in this Area
Purchase History
| Date | Buyer | Sale Price | Title Company |
|---|---|---|---|
| Christensen Travis | -- | Founders Title Co | |
| Heaston Adam G | -- | First American Title |
Source: Public Records
Mortgage History
| Date | Status | Borrower | Loan Amount |
|---|---|---|---|
| Open | Christensen Travis | $150,100 | |
| Previous Owner | Heaston Adam G | $144,337 |
Source: Public Records
Tax History
| Year | Tax Paid | Tax Assessment Tax Assessment Total Assessment is a certain percentage of the fair market value that is determined by local assessors to be the total taxable value of land and additions on the property. | Land | Improvement |
|---|---|---|---|---|
| 2025 | $1,981 | $207,900 | $111,512 | $96,388 |
| 2024 | $1,930 | $204,050 | $134,239 | $69,811 |
| 2023 | $1,771 | $330,000 | $138,534 | $191,466 |
| 2022 | $1,902 | $192,500 | $82,795 | $109,705 |
| 2021 | $1,782 | $269,000 | $124,191 | $144,809 |
| 2020 | $1,595 | $231,000 | $105,497 | $125,503 |
| 2019 | $1,544 | $219,000 | $105,815 | $113,185 |
| 2018 | $1,355 | $193,000 | $93,075 | $99,925 |
| 2016 | $1,206 | $88,605 | $37,810 | $50,795 |
| 2015 | $1,195 | $83,325 | $37,810 | $45,515 |
| 2014 | $1,289 | $91,921 | $37,810 | $54,111 |
| 2013 | -- | $76,288 | $35,156 | $41,132 |
Source: Public Records
Map
Nearby Homes
Your Personal Tour Guide
Ask me questions while you tour the home.