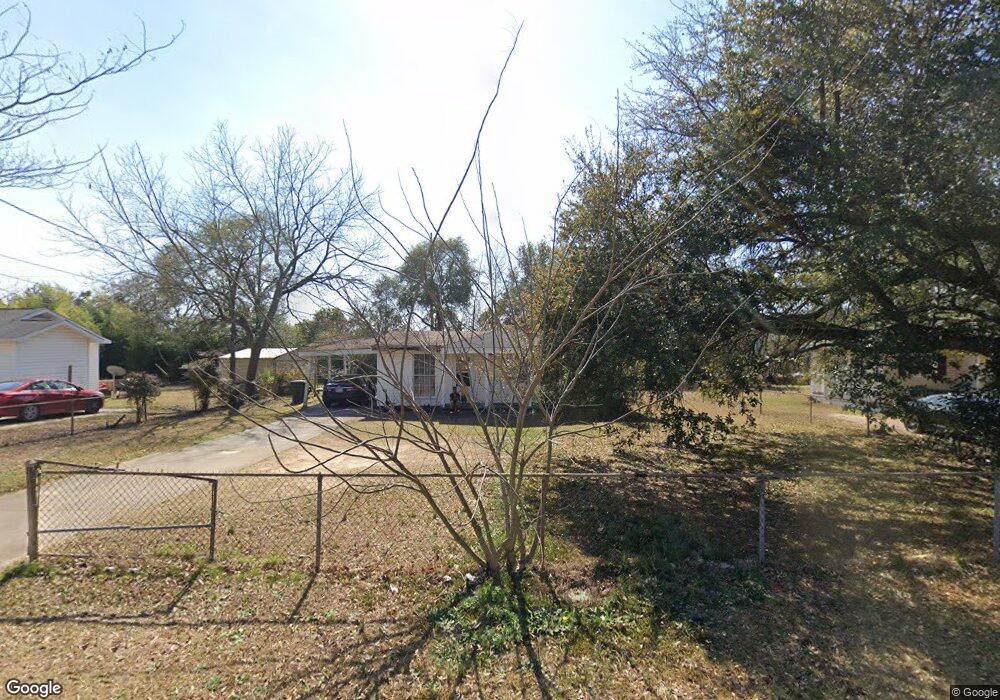
106 Forsyth St Fort Valley, GA 31030
Estimated Value: $52,000 - $109,000
3
Beds
1
Bath
1,008
Sq Ft
$86/Sq Ft
Est. Value
About This Home
This home is located at 106 Forsyth St, Fort Valley, GA 31030 and is currently estimated at $86,864, approximately $86 per square foot. 106 Forsyth St is a home located in Peach County with nearby schools including Kay Road Elementary School, Fort Valley Middle School, and Peach County High School.
Ownership History
Date
Name
Owned For
Owner Type
Purchase Details
Closed on
Nov 16, 2023
Sold by
Milton Garrett
Bought by
Gm Property Managment Llc
Current Estimated Value
Purchase Details
Closed on
Oct 26, 2023
Sold by
Milton Cheryl
Bought by
Milton Garrett
Purchase Details
Closed on
Jul 16, 1998
Bought by
Milton Garrett and Milton Cheryl
Purchase Details
Closed on
Jun 3, 1997
Bought by
Us Dept Of Hud
Purchase Details
Closed on
May 1, 1995
Bought by
Durden Randall
Purchase Details
Closed on
Aug 18, 1989
Bought by
Rhodes Robert S
Purchase Details
Closed on
Oct 31, 1988
Bought by
Roach Jimmy D and Roach Sue J
Purchase Details
Closed on
Nov 29, 1985
Bought by
Manning Tony G and Manning Glenda W
Purchase Details
Closed on
Jul 2, 1985
Bought by
Humble Mary M
Purchase Details
Closed on
Mar 21, 1985
Bought by
Farmers Home Admin
Purchase Details
Closed on
Sep 4, 1981
Bought by
Dailey Elizabeth H
Create a Home Valuation Report for This Property
The Home Valuation Report is an in-depth analysis detailing your home's value as well as a comparison with similar homes in the area
Home Values in the Area
Average Home Value in this Area
Purchase History
| Date | Buyer | Sale Price | Title Company |
|---|---|---|---|
| Gm Property Managment Llc | -- | -- | |
| Milton Garrett | -- | -- | |
| Milton Garrett | -- | -- | |
| Us Dept Of Hud | -- | -- | |
| Durden Randall | $25,100 | -- | |
| Rhodes Robert S | $36,600 | -- | |
| Roach Jimmy D | $35,100 | -- | |
| Manning Tony G | $32,300 | -- | |
| Humble Mary M | $14,000 | -- | |
| Farmers Home Admin | -- | -- | |
| Dailey Elizabeth H | $18,500 | -- |
Source: Public Records
Tax History Compared to Growth
Tax History
| Year | Tax Paid | Tax Assessment Tax Assessment Total Assessment is a certain percentage of the fair market value that is determined by local assessors to be the total taxable value of land and additions on the property. | Land | Improvement |
|---|---|---|---|---|
| 2024 | $882 | $21,160 | $3,440 | $17,720 |
| 2023 | $760 | $18,120 | $2,800 | $15,320 |
| 2022 | $460 | $17,080 | $2,800 | $14,280 |
| 2021 | $441 | $14,120 | $2,760 | $11,360 |
| 2020 | $799 | $17,280 | $2,760 | $14,520 |
| 2019 | $801 | $17,280 | $2,760 | $14,520 |
| 2018 | $804 | $17,280 | $2,760 | $14,520 |
| 2017 | $752 | $17,280 | $2,760 | $14,520 |
| 2016 | $837 | $19,280 | $2,760 | $16,520 |
| 2015 | $609 | $19,280 | $2,760 | $16,520 |
| 2014 | $610 | $19,280 | $2,760 | $16,520 |
| 2013 | -- | $19,280 | $2,760 | $16,520 |
Source: Public Records
Map
Nearby Homes
- 120 Jamie Ct
- LOT 10 Taylors Mill Rd
- Lot 7 & 8 Taylors Mill Rd
- 403 Vienna St Unit 8
- 507 Burnett St
- 108 Vienna St
- 509 Anderson Ave
- 805 E Church St
- 701 E Church St
- 412 Walden St
- 209 Valley Dr
- 203 Vienna Cir
- 502 Peachtree St
- 514 Hinton St
- 2690 E Lawson Merritt Rd
- 1598 N Taylor Mills Roads
- 209 Calhoun St
- 522 Hinton St
- 504 Park Ave
- 301 Oak St
- 108 Forsyth St
- 104 Forsyth St
- 110 Forsyth St
- 107 Forsyth St
- 105 Forsyth St
- 103 Forsyth St
- 112 Forsyth St
- 101 Forsyth St
- 145 Willow Way
- 114 Forsyth St
- 113 Forsyth St
- 116 Forsyth St
- 115 Forsyth St
- 503 Bluebird Blvd
- 117 Forsyth St
- 124 Forsyth St
- 121 Forsyth St
- 11 Taylors Mill Rd
- 10 Taylors Mill Rd
- 9 Taylors Mill Rd