106 G St NW Ardmore, OK 73401
Estimated Value: $106,000 - $146,000
1
Bed
1
Bath
1,486
Sq Ft
$83/Sq Ft
Est. Value
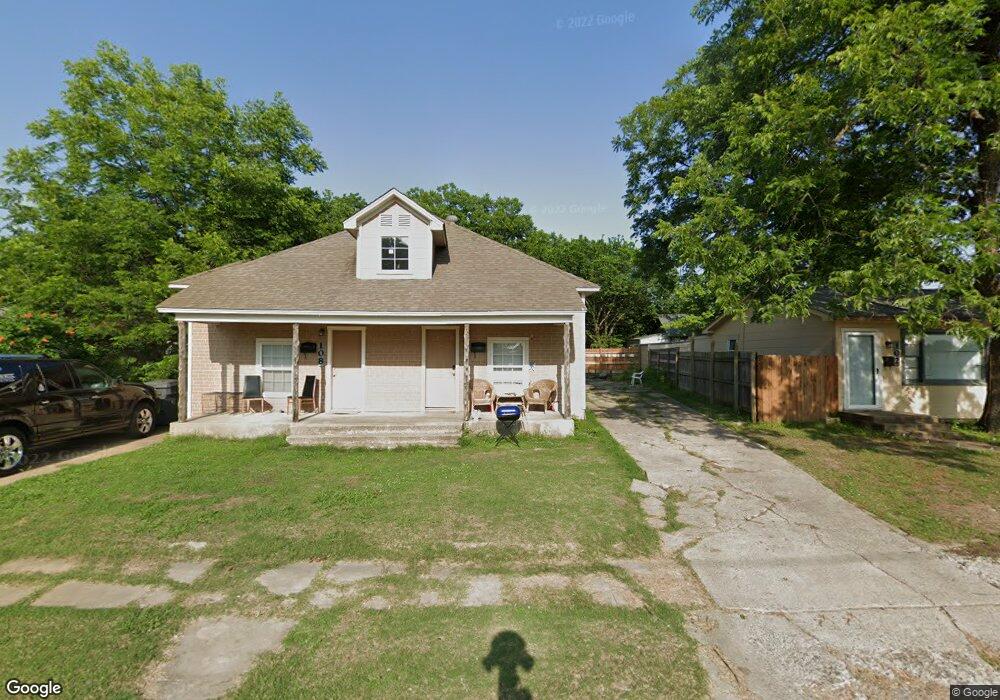
About This Home
This home is located at 106 G St NW, Ardmore, OK 73401 and is currently estimated at $123,724, approximately $83 per square foot. 106 G St NW is a home located in Carter County with nearby schools including Lincoln Elementary School, Ardmore Middle School, and Ardmore High School.
Ownership History
Date
Name
Owned For
Owner Type
Purchase Details
Closed on
Dec 11, 2009
Sold by
John Arthur Shuey Trust
Bought by
Mcpherson Michael and Mcpherson Jana M
Current Estimated Value
Home Financials for this Owner
Home Financials are based on the most recent Mortgage that was taken out on this home.
Original Mortgage
$22,184
Interest Rate
4.9%
Mortgage Type
Commercial
Purchase Details
Closed on
Aug 27, 2009
Sold by
Thanos Nicholas and Thanos Victoria M
Bought by
Mcpherson Michael and Mcpherson Jana
Home Financials for this Owner
Home Financials are based on the most recent Mortgage that was taken out on this home.
Original Mortgage
$22,184
Interest Rate
4.9%
Mortgage Type
Commercial
Purchase Details
Closed on
Jul 25, 2000
Sold by
Hickman Billy Jack
Bought by
Shuey John and Shuey Thanos Nic
Purchase Details
Closed on
Jul 10, 2000
Sold by
Hickman Rebecca Rose
Bought by
Hickman Billy Jack
Purchase Details
Closed on
Jun 3, 1994
Sold by
Hickman Jack
Bought by
Hickman Billy Jack
Create a Home Valuation Report for This Property
The Home Valuation Report is an in-depth analysis detailing your home's value as well as a comparison with similar homes in the area
Home Values in the Area
Average Home Value in this Area
Purchase History
| Date | Buyer | Sale Price | Title Company |
|---|---|---|---|
| Mcpherson Michael | $10,000 | -- | |
| Mcpherson Michael | $10,000 | -- | |
| Shuey John | $3,000 | -- | |
| Hickman Billy Jack | -- | -- | |
| Hickman Billy Jack | -- | -- |
Source: Public Records
Mortgage History
| Date | Status | Borrower | Loan Amount |
|---|---|---|---|
| Closed | Mcpherson Michael | $22,184 | |
| Previous Owner | Mcpherson Michael | $22,184 |
Source: Public Records
Tax History Compared to Growth
Tax History
| Year | Tax Paid | Tax Assessment Tax Assessment Total Assessment is a certain percentage of the fair market value that is determined by local assessors to be the total taxable value of land and additions on the property. | Land | Improvement |
|---|---|---|---|---|
| 2024 | $469 | $4,751 | $1,042 | $3,709 |
| 2023 | $447 | $4,525 | $1,017 | $3,508 |
| 2022 | $412 | $4,309 | $989 | $3,320 |
| 2021 | $414 | $4,104 | $957 | $3,147 |
| 2020 | $389 | $3,909 | $916 | $2,993 |
| 2019 | $361 | $3,723 | $873 | $2,850 |
| 2018 | $350 | $3,546 | $831 | $2,715 |
| 2017 | $309 | $3,377 | $791 | $2,586 |
| 2016 | $300 | $3,216 | $758 | $2,458 |
| 2015 | $235 | $3,063 | $134 | $2,929 |
| 2014 | $224 | $2,917 | $119 | $2,798 |
Source: Public Records
Map
Nearby Homes
- 518 3rd Ave NW
- 615 3rd Ave NW
- 606 W Broadway St
- 328 G St NW
- 402 E St NW
- 405 4th Ave NW
- 501 NW E St St
- 121 F St SW
- 1013 W Main St
- 141 G St SW
- 420 Stanley Ave SW
- 214 E St SW
- 0 N Commerce St Unit 2517610
- 0 N Commerce St Unit 2530001
- 0 A St NW
- 822 Stanley St SW
- 602 B St NW
- 711 3rd Ave SW
- 8 W Main St
- 802 Northwest Blvd