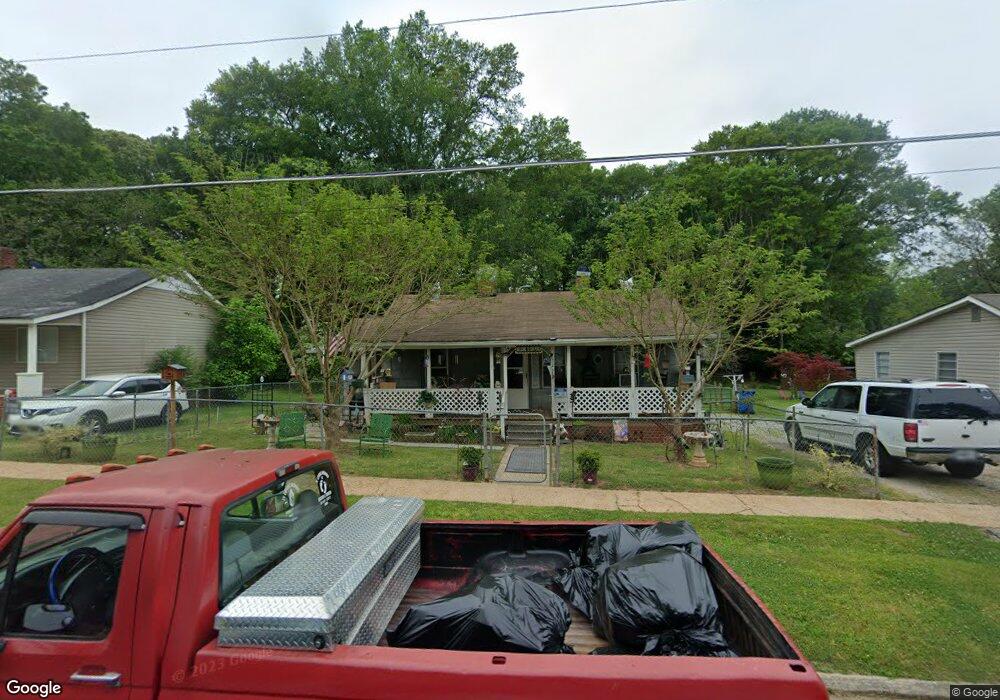
106 Greenough St Unit BLOCK/LOT 9 Hogansville, GA 30230
Estimated Value: $105,000 - $149,000
3
Beds
1
Bath
960
Sq Ft
$134/Sq Ft
Est. Value
About This Home
This home is located at 106 Greenough St Unit BLOCK/LOT 9, Hogansville, GA 30230 and is currently estimated at $128,876, approximately $134 per square foot. 106 Greenough St Unit BLOCK/LOT 9 is a home located in Troup County with nearby schools including Hogansville Elementary School, Callaway Elementary School, and Callaway Middle School.
Ownership History
Date
Name
Owned For
Owner Type
Purchase Details
Closed on
Jul 31, 2013
Sold by
Federal Deposit Insurance Corporation
Bought by
Webb Kellie
Current Estimated Value
Purchase Details
Closed on
Dec 7, 2010
Sold by
Greenville Mtg Corp
Bought by
Frontier Bank
Purchase Details
Closed on
Nov 7, 2001
Sold by
Talbot State Bank
Bought by
Keith L L Dba Greenville Ins
Purchase Details
Closed on
Jul 25, 2001
Sold by
Richard L Gossett
Bought by
Talbot State Bank
Purchase Details
Closed on
Jan 2, 2001
Sold by
Greenville Mort Corp
Bought by
Richard L Gossett
Purchase Details
Closed on
Aug 5, 1992
Sold by
Talbot
Bought by
Greenville Mort Corp
Purchase Details
Closed on
Feb 4, 1992
Sold by
Meacham Sherry and Meacham David
Bought by
Talbot
Purchase Details
Closed on
Sep 18, 1991
Bought by
Meacham Sherry and Meacham David
Purchase Details
Closed on
Jan 1, 1966
Sold by
Polly Theodore and Polly Mckoon
Create a Home Valuation Report for This Property
The Home Valuation Report is an in-depth analysis detailing your home's value as well as a comparison with similar homes in the area
Home Values in the Area
Average Home Value in this Area
Purchase History
| Date | Buyer | Sale Price | Title Company |
|---|---|---|---|
| Webb Kellie | $5,000 | -- | |
| Frontier Bank | -- | -- | |
| Keith L L Dba Greenville Ins | -- | -- | |
| Talbot State Bank | $23,500 | -- | |
| Richard L Gossett | -- | -- | |
| Greenville Mort Corp | $26,000 | -- | |
| Talbot | -- | -- | |
| Meacham Sherry | -- | -- | |
| -- | -- | -- |
Source: Public Records
Tax History Compared to Growth
Tax History
| Year | Tax Paid | Tax Assessment Tax Assessment Total Assessment is a certain percentage of the fair market value that is determined by local assessors to be the total taxable value of land and additions on the property. | Land | Improvement |
|---|---|---|---|---|
| 2024 | $616 | $25,200 | $8,000 | $17,200 |
| 2023 | $52 | $24,120 | $8,000 | $16,120 |
| 2022 | $378 | $18,280 | $4,000 | $14,280 |
| 2021 | $133 | $11,360 | $1,800 | $9,560 |
| 2020 | $133 | $11,360 | $1,800 | $9,560 |
| 2019 | $118 | $10,960 | $1,800 | $9,160 |
| 2018 | $377 | $9,880 | $1,800 | $8,080 |
| 2017 | $346 | $9,070 | $1,950 | $7,120 |
| 2016 | $355 | $9,328 | $1,950 | $7,378 |
| 2015 | $259 | $6,777 | $1,820 | $4,957 |
| 2014 | $188 | $4,919 | $1,820 | $3,099 |
| 2013 | -- | $6,438 | $1,820 | $4,618 |
Source: Public Records
Map
Nearby Homes
- 215 Johnson St
- 213 Johnson St
- 208 Church St
- 100 International St
- 0 Georgia 100 Unit 10591508
- 613 Rifle Ridge
- 617 Rifle Ridge
- 619 Rifle Ridge
- 608 Rifle Ridge
- 614 Rifle Ridge
- 400 Lawrence St
- 201 Oak St
- 407 Green Ave
- 214 Collier St
- 117 Duck Walk Way
- 209 Duck Walk Way
- 113 Ware St
- 341 Foxtrot Trail
- 340 Foxtrot Trail
- 342 Foxtrot Trail
- 106 Greenough St
- 108 Greenough St
- 104 Greenough St
- 110 Greenough St
- 109 Baugh Ave
- 102 Greenough St
- 109 Greenough St
- 111 Greenough St
- 107 Baugh Ave
- 0 Greenough St Unit 7341064
- 0 Greenough St Unit 8438572
- 0 Greenough St Unit 8196603
- 0 Greenough St Unit 7588767
- 0 Greenough St Unit 8099947
- 0 Greenough St Unit 7412116
- 0 Greenough St Unit 3264361
- 0 Greenough St Unit 7071344
- 0 Baugh Ave
- 107 Greenough St
- 100 Greenough St