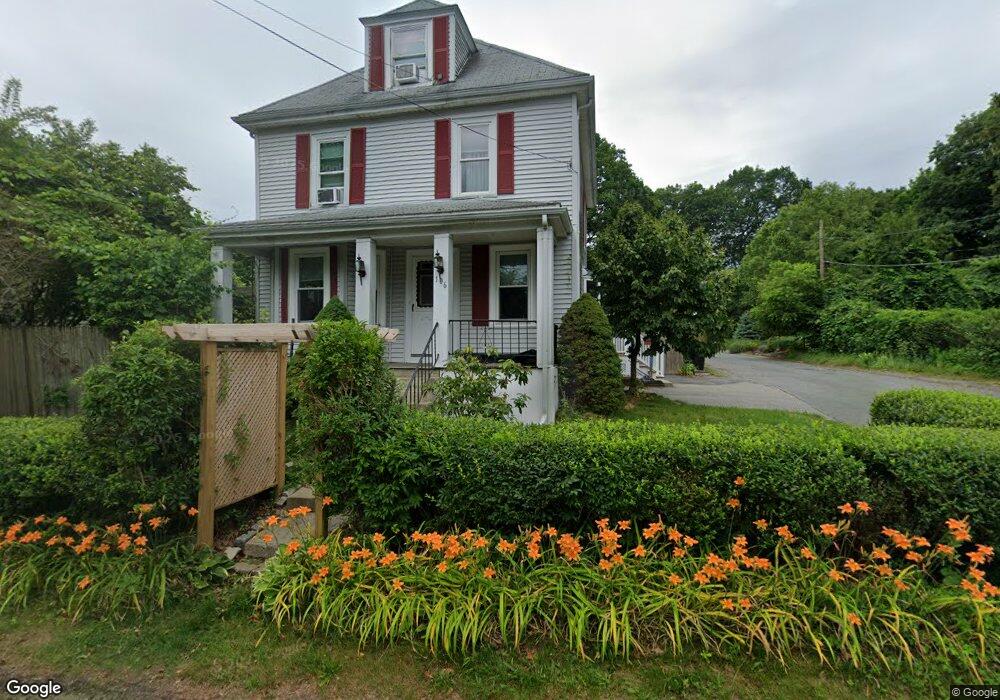
106 Hancock St Whitman, MA 02382
Estimated Value: $496,000 - $530,000
3
Beds
2
Baths
1,352
Sq Ft
$377/Sq Ft
Est. Value
About This Home
This home is located at 106 Hancock St, Whitman, MA 02382 and is currently estimated at $510,148, approximately $377 per square foot. 106 Hancock St is a home located in Plymouth County with nearby schools including St Bridget School.
Ownership History
Date
Name
Owned For
Owner Type
Purchase Details
Closed on
Apr 14, 2022
Sold by
Mccormack Timothy A and Mccormack Tamara D
Bought by
Mccormack Timothy
Current Estimated Value
Home Financials for this Owner
Home Financials are based on the most recent Mortgage that was taken out on this home.
Original Mortgage
$325,000
Outstanding Balance
$302,545
Interest Rate
3.76%
Mortgage Type
New Conventional
Estimated Equity
$207,603
Purchase Details
Closed on
Nov 30, 2016
Sold by
Mccormack Timothy A
Bought by
Mccormack Timothy A and Mccormack Tamara D
Home Financials for this Owner
Home Financials are based on the most recent Mortgage that was taken out on this home.
Original Mortgage
$213,000
Interest Rate
3.52%
Mortgage Type
New Conventional
Purchase Details
Closed on
Nov 25, 2003
Sold by
Quirk Lawrence P and Quirk Patricia A
Bought by
Mccormack Timothy A
Create a Home Valuation Report for This Property
The Home Valuation Report is an in-depth analysis detailing your home's value as well as a comparison with similar homes in the area
Home Values in the Area
Average Home Value in this Area
Purchase History
| Date | Buyer | Sale Price | Title Company |
|---|---|---|---|
| Mccormack Timothy | -- | None Available | |
| Mccormack Timothy | -- | None Available | |
| Mccormack Timothy A | -- | -- | |
| Mccormack Timothy A | -- | -- | |
| Mccormack Timothy A | $258,000 | -- | |
| Mccormack Timothy A | -- | -- | |
| Mccormack Timothy A | $258,000 | -- |
Source: Public Records
Mortgage History
| Date | Status | Borrower | Loan Amount |
|---|---|---|---|
| Open | Mccormack Timothy | $325,000 | |
| Closed | Mccormack Timothy | $325,000 | |
| Previous Owner | Mccormack Timothy A | $213,000 |
Source: Public Records
Tax History Compared to Growth
Tax History
| Year | Tax Paid | Tax Assessment Tax Assessment Total Assessment is a certain percentage of the fair market value that is determined by local assessors to be the total taxable value of land and additions on the property. | Land | Improvement |
|---|---|---|---|---|
| 2025 | $5,656 | $431,100 | $196,700 | $234,400 |
| 2024 | $5,343 | $419,400 | $192,900 | $226,500 |
| 2023 | $5,119 | $377,200 | $167,200 | $210,000 |
| 2022 | $5,049 | $346,800 | $152,000 | $194,800 |
| 2021 | $4,856 | $313,300 | $139,700 | $173,600 |
| 2020 | $4,660 | $294,000 | $126,400 | $167,600 |
| 2019 | $4,382 | $284,900 | $126,400 | $158,500 |
| 2018 | $4,065 | $253,900 | $119,700 | $134,200 |
| 2017 | $3,829 | $253,900 | $119,700 | $134,200 |
| 2016 | $3,622 | $232,300 | $114,000 | $118,300 |
| 2015 | $3,626 | $232,300 | $114,000 | $118,300 |
Source: Public Records
Map
Nearby Homes
- 66 Belmont St
- 164 Warren Ave
- 300 High St
- 135-137 Temple St
- 604 Bedford St Unit 5
- 1098 Bedford St
- 53 Temple St
- 551 Bedford St Unit B4
- 63 Dewey Ave
- 277 School St
- 532 Washington St
- 360 High St
- 262 Homeland Dr
- 110 South Ave Unit 14
- 4 Locust Hill Ln
- 48 Day St
- 501 Auburn St Unit 404
- 501 Auburn St Unit 201
- 150 Harvard St
- 20 Elm Place
- 16 Easy St
- 96 Hancock St
- 109 Hancock St
- 17 Easy St
- 20 Easy St
- 115 Hancock St
- 115 Hancock St Unit 1
- 77 Hancock St
- 160 Rock St
- 150 Belmont St
- 23 Easy St
- 121 Hancock St
- 79 Hancock St
- 154 Rock St
- M 2 Auburnville Way
- M 2 Auburnville Way Unit M 2
- #2 Auburn Street Lot #2
- 34 Forest St
- 38 Forest St
- 71 Hancock St