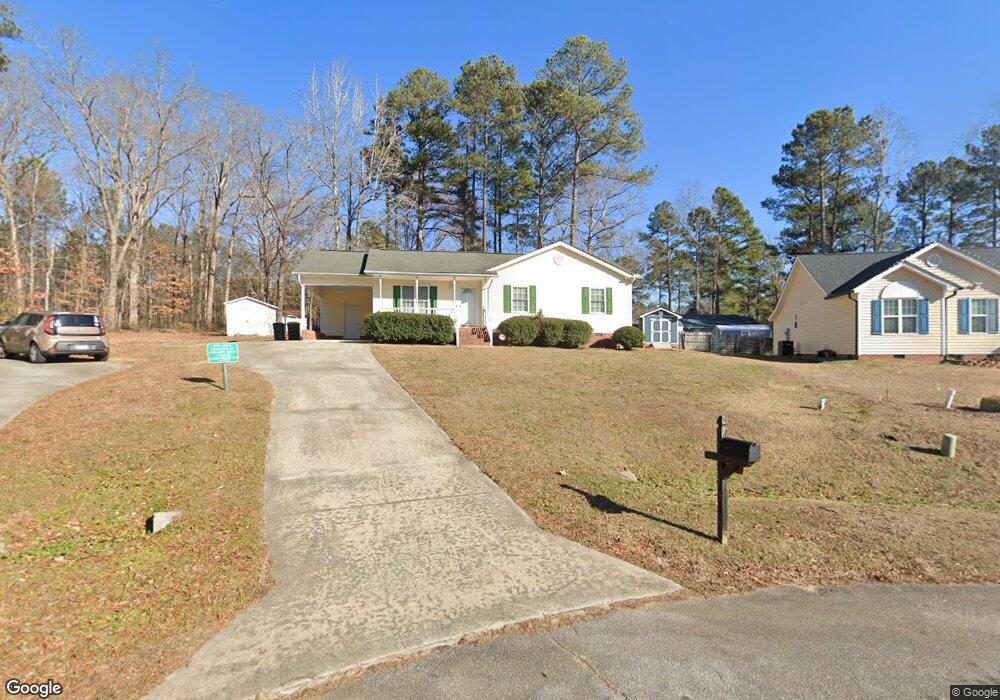
106 Hazelwood Ct Oxford, NC 27565
Estimated Value: $211,018 - $276,000
--
Bed
2
Baths
1,108
Sq Ft
$226/Sq Ft
Est. Value
About This Home
This home is located at 106 Hazelwood Ct, Oxford, NC 27565 and is currently estimated at $250,755, approximately $226 per square foot. 106 Hazelwood Ct is a home located in Granville County with nearby schools including Stovall-Shaw Elementary School, Northern Granville Middle School, and Granville Central High School.
Ownership History
Date
Name
Owned For
Owner Type
Purchase Details
Closed on
Mar 18, 2025
Sold by
Boyd Aishah M
Bought by
Fuller Eric Lamont
Current Estimated Value
Home Financials for this Owner
Home Financials are based on the most recent Mortgage that was taken out on this home.
Original Mortgage
$50,500
Outstanding Balance
$50,243
Interest Rate
6.89%
Mortgage Type
Credit Line Revolving
Estimated Equity
$200,512
Purchase Details
Closed on
Sep 8, 2020
Sold by
Serf Uwe R and Serf Wendy R
Bought by
Fuller Eric Lamont and Boyd Aishah M
Home Financials for this Owner
Home Financials are based on the most recent Mortgage that was taken out on this home.
Original Mortgage
$156,120
Interest Rate
2.9%
Mortgage Type
FHA
Purchase Details
Closed on
Mar 25, 2004
Bought by
Lockett George E and Lockett Wendy R
Create a Home Valuation Report for This Property
The Home Valuation Report is an in-depth analysis detailing your home's value as well as a comparison with similar homes in the area
Home Values in the Area
Average Home Value in this Area
Purchase History
| Date | Buyer | Sale Price | Title Company |
|---|---|---|---|
| Fuller Eric Lamont | -- | None Listed On Document | |
| Fuller Eric Lamont | -- | None Listed On Document | |
| Fuller Eric Lamont | -- | None Available | |
| Fuller Eric Lamont | $159,000 | None Available | |
| Lockett George E | -- | -- |
Source: Public Records
Mortgage History
| Date | Status | Borrower | Loan Amount |
|---|---|---|---|
| Open | Fuller Eric Lamont | $50,500 | |
| Closed | Fuller Eric Lamont | $50,500 | |
| Previous Owner | Fuller Eric Lamont | $156,120 |
Source: Public Records
Tax History Compared to Growth
Tax History
| Year | Tax Paid | Tax Assessment Tax Assessment Total Assessment is a certain percentage of the fair market value that is determined by local assessors to be the total taxable value of land and additions on the property. | Land | Improvement |
|---|---|---|---|---|
| 2025 | $2,080 | $176,323 | $25,000 | $151,323 |
| 2024 | $2,080 | $176,323 | $25,000 | $151,323 |
| 2023 | $2,078 | $117,310 | $20,000 | $97,310 |
| 2022 | $1,761 | $117,310 | $20,000 | $97,310 |
| 2021 | $1,756 | $117,310 | $20,000 | $97,310 |
| 2020 | $1,756 | $117,310 | $20,000 | $97,310 |
| 2019 | $1,756 | $117,310 | $20,000 | $97,310 |
| 2018 | $1,756 | $117,310 | $20,000 | $97,310 |
| 2016 | $1,777 | $115,585 | $20,000 | $95,585 |
| 2015 | $1,714 | $115,585 | $20,000 | $95,585 |
| 2014 | $1,714 | $115,585 | $20,000 | $95,585 |
| 2013 | -- | $115,585 | $20,000 | $95,585 |
Source: Public Records
Map
Nearby Homes
- 107 Flue Ct
- 504 Rhino Bend
- 101 Flue Ct
- 104 Flue Ct
- 111 Rhino Bend
- 100 Flue Ct
- 102 Cultivar St
- 501 Benton Dr
- 103 Scoville St
- 201 Benton Dr
- Blanco Plan at The Meadows at Oxford
- Carolina Plan at The Meadows at Oxford
- Burke Plan at The Meadows at Oxford
- Camden Plan at The Meadows at Oxford
- Birch Plan at The Meadows at Oxford
- 903 Rhino Bend
- 900 Rhino Bend
- 1009 Rhino Bend
- 1017 Rhino Bend
- 1101 Rhino Bend
- 108 Hazelwood Ct
- 104 Hazelwood Ct
- 107 Green Tree Cir
- 107 Greentree Cir
- 105 Green Tree Cir
- 109 Green Tree Cir
- 102 Hazelwood Ct
- 22 Hazelwood Ct
- 103 Green Tree Cir
- 109 Hazelwood Ct
- 107 Hazelwood Ct
- 105 Hazelwood Ct
- 204 Polly Rd
- 206 Polly Rd
- 202 Polly Rd
- 103 Hazelwood Ct
- 102 Green Tree Cir
- 206 Polly Dr
- 200 Polly Rd
- 300 Polly Rd