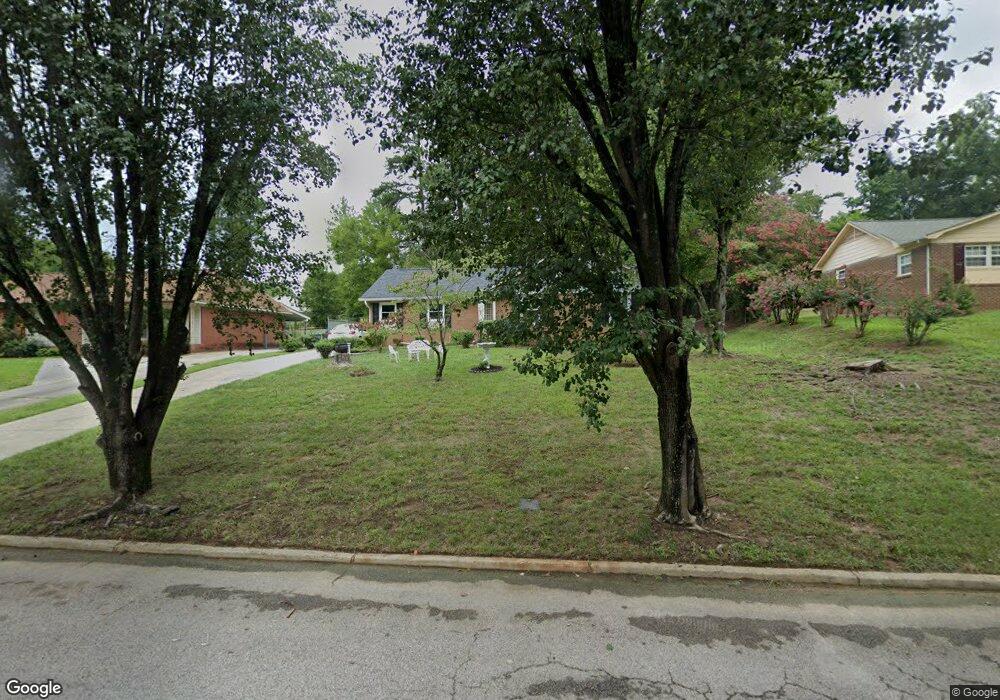
106 Hemlock Dr Salisbury, NC 28147
Estimated Value: $223,923 - $282,000
--
Bed
2
Baths
1,433
Sq Ft
$170/Sq Ft
Est. Value
About This Home
This home is located at 106 Hemlock Dr, Salisbury, NC 28147 and is currently estimated at $243,731, approximately $170 per square foot. 106 Hemlock Dr is a home located in Rowan County with nearby schools including H D Isenberg Elementary, West Rowan Middle School, and West Rowan High School.
Create a Home Valuation Report for This Property
The Home Valuation Report is an in-depth analysis detailing your home's value as well as a comparison with similar homes in the area
Home Values in the Area
Average Home Value in this Area
Tax History Compared to Growth
Tax History
| Year | Tax Paid | Tax Assessment Tax Assessment Total Assessment is a certain percentage of the fair market value that is determined by local assessors to be the total taxable value of land and additions on the property. | Land | Improvement |
|---|---|---|---|---|
| 2025 | $1,926 | $161,047 | $35,000 | $126,047 |
| 2024 | $1,926 | $161,047 | $35,000 | $126,047 |
| 2023 | $963 | $161,047 | $35,000 | $126,047 |
| 2022 | $734 | $106,667 | $23,000 | $83,667 |
| 2021 | $1,469 | $106,667 | $23,000 | $83,667 |
| 2020 | $734 | $106,667 | $23,000 | $83,667 |
| 2019 | $734 | $106,667 | $23,000 | $83,667 |
| 2018 | $636 | $93,576 | $23,000 | $70,576 |
| 2017 | $632 | $93,576 | $23,000 | $70,576 |
| 2016 | $615 | $93,576 | $23,000 | $70,576 |
| 2015 | $619 | $93,576 | $23,000 | $70,576 |
| 2014 | $633 | $96,808 | $23,000 | $73,808 |
Source: Public Records
Map
Nearby Homes
- 101 Hemlock Dr
- 427 Willow Rd
- 114 Elmwood Dr
- 2417 Statesville Blvd
- 202 Cedarwood Dr
- 3045 Woodleaf Rd
- 531 Cooley Dr
- 525 Cooley Dr
- 519 Cooley Dr
- 150 Magnolia Cir
- 339 Wicker Dr
- 328 Wicker Dr
- The Harrington Plan at Winecoff
- The Coleman Plan at Winecoff
- The Crawford Plan at Winecoff
- The Bradley Plan at Winecoff
- The Benson II Plan at Winecoff
- The McGinnis Plan at Winecoff
- The Braselton II Plan at Winecoff
- The Piedmont Plan at Winecoff
- 108 Hemlock Dr
- 104 Hemlock Dr
- 110 Hemlock Dr
- 8 Post Oak Place
- 401 Ashbrook Rd
- 403 Ashbrook Rd
- 105 Hemlock Dr
- 112 Hemlock Dr
- 405 Ashbrook Rd
- 10 Post Oak Place
- 107 Hemlock Dr
- 103 Hemlock Dr
- 103 Hemlock Dr Unit 13
- 109 Hemlock Dr
- 114 Hemlock Dr
- 407 Ashbrook Rd
- 111 Hemlock Dr
- 0 Ashbrook Rd
- 00 Ashbrook Rd
- 11 Post Oak Place