T
Seller's Agent in 2025
The Bauman Group
Gibson Sotheby's International Realty
(781) 444-8383
103 Total Sales
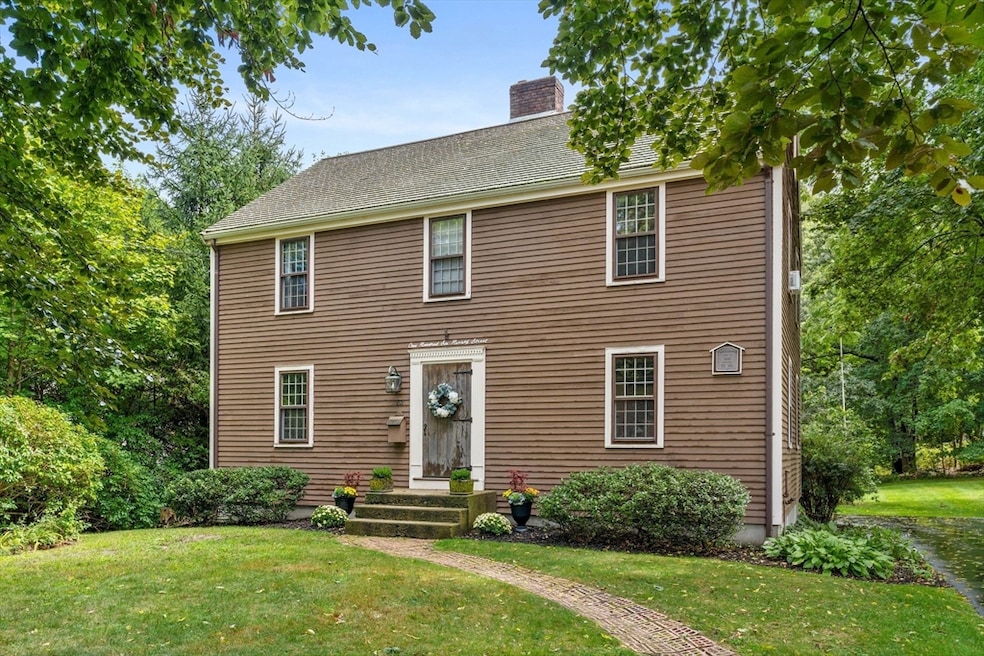


Step into timeless elegance with this inviting Colonial, located minutes from Hingham’s historic downtown. Elegant curb appeal, traditional architecture, and sun filled rooms create a warm and inviting atmosphere.The thoughtfully designed layout features a spacious and bright front to back living room with a welcoming fireplace, a large country eat-in kitchen, and separate formal dining room.The kitchen flows seamlessly into a bright sunroom with floor to ceiling windows overlooking a lush, private backyard. A perfect setting for casual gatherings, morning coffee, or just relaxing. Upstairs, 3 comfortable bedrooms offer privacy and flexibility for family, guests or home office. Relax in the large soaking, whirlpool tub under a bright skylight in the main bathroom.The spacious third floor attic is great for storage or maybe a future bonus room. Enjoy a lifestyle that blends coastal charm, historic character, and a strong sense of community in this beautiful sought after neighborhood!
Last Agent to Sell the Property
Gibson Sotheby's International Realty Listed on: 09/04/2025

Co-Listed By
Kathleen DiTullio
Gibson Sotheby's International Realty
| Date | Type | Sale Price | Title Company |
|---|---|---|---|
| Deed | $930,000 | -- | |
| Quit Claim Deed | -- | -- | |
| Deed | -- | -- | |
| Deed | -- | -- | |
| Deed | $1,300 | -- | |
| Deed | $1,300 | -- |
| Date | Status | Loan Amount | Loan Type |
|---|---|---|---|
| Open | $651,000 | Purchase Money Mortgage | |
| Previous Owner | $200,000 | No Value Available | |
| Previous Owner | $63,000 | No Value Available |
| Date | Event | Price | List to Sale | Price per Sq Ft |
|---|---|---|---|---|
| 10/31/2025 10/31/25 | Sold | $930,000 | -6.0% | $524 / Sq Ft |
| 09/19/2025 09/19/25 | Pending | -- | -- | -- |
| 09/04/2025 09/04/25 | For Sale | $989,000 | -- | $557 / Sq Ft |
| Year | Tax Paid | Tax Assessment Tax Assessment Total Assessment is a certain percentage of the fair market value that is determined by local assessors to be the total taxable value of land and additions on the property. | Land | Improvement |
|---|---|---|---|---|
| 2025 | $9,145 | $855,500 | $467,200 | $388,300 |
| 2024 | $8,873 | $817,800 | $467,200 | $350,600 |
| 2023 | $7,856 | $785,600 | $467,200 | $318,400 |
| 2022 | $7,431 | $642,800 | $389,400 | $253,400 |
| 2021 | $7,317 | $620,100 | $389,400 | $230,700 |
| 2020 | $7,150 | $620,100 | $389,400 | $230,700 |
| 2019 | $7,144 | $604,900 | $389,400 | $215,500 |
| 2018 | $210 | $604,900 | $389,400 | $215,500 |
| 2017 | $6,948 | $567,200 | $380,800 | $186,400 |
| 2016 | $6,858 | $549,100 | $362,700 | $186,400 |
| 2015 | $6,665 | $531,900 | $345,500 | $186,400 |
T
Seller's Agent in 2025
The Bauman Group
Gibson Sotheby's International Realty
(781) 444-8383
103 Total Sales
K
Seller Co-Listing Agent in 2025
Kathleen DiTullio
Gibson Sotheby's International Realty
Source: MLS Property Information Network (MLS PIN)
MLS Number: 73425832
APN: HING-000080-000000-000018
Disclaimer: Certain information contained herein is derived from information provided by parties other than Homes.com. All information provided is deemed reliable, but is not guaranteed to be accurate and should be independently verified.
![]() The property listing data and information, or the Images, set forth herein were provided to MLS Property Information Network, Inc. from third party sources, including sellers, lessors and public records, and were compiled by MLS Property Information Network, Inc. The property listing data and information, and the Images, are for the personal, non-commercial use of consumers having a good faith interest in purchasing or leasing listed properties of the type displayed to them and may not be used for any purpose other than to identify prospective properties which such consumers may have a good faith interest in purchasing or leasing. MLS Property Information Network, Inc. and its subscribers disclaim any and all representations and warranties as to the accuracy of the property listing data and information, or as to the accuracy of any of the Images, set forth herein.
The property listing data and information, or the Images, set forth herein were provided to MLS Property Information Network, Inc. from third party sources, including sellers, lessors and public records, and were compiled by MLS Property Information Network, Inc. The property listing data and information, and the Images, are for the personal, non-commercial use of consumers having a good faith interest in purchasing or leasing listed properties of the type displayed to them and may not be used for any purpose other than to identify prospective properties which such consumers may have a good faith interest in purchasing or leasing. MLS Property Information Network, Inc. and its subscribers disclaim any and all representations and warranties as to the accuracy of the property listing data and information, or as to the accuracy of any of the Images, set forth herein.
Ask me questions while you tour the home.