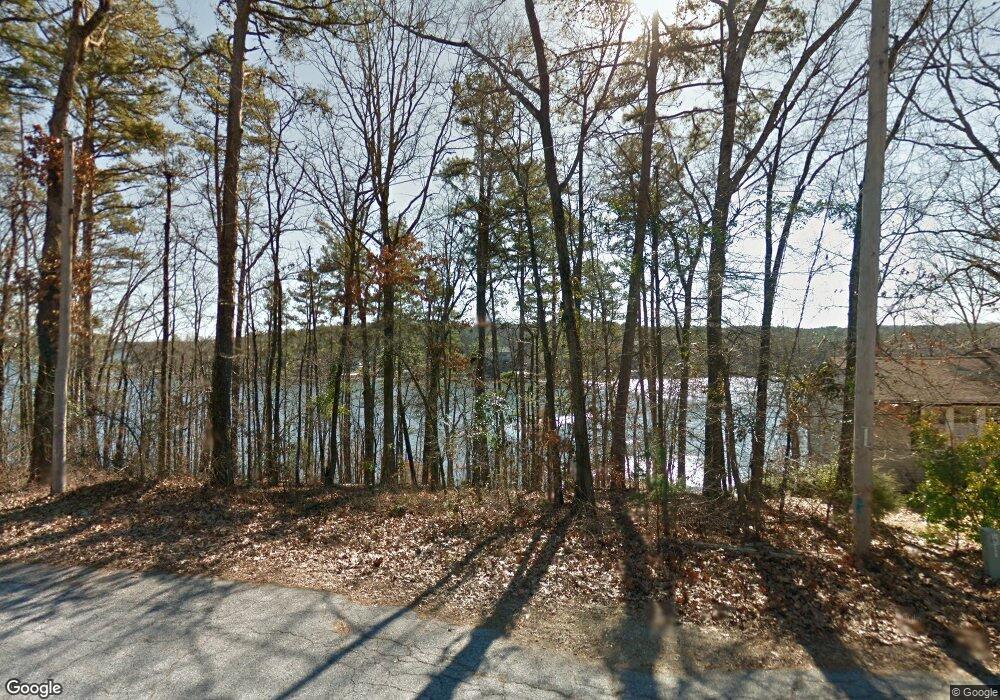
106 Hideaway Hills Place Hot Springs National Park, AR 71901
Estimated Value: $494,000 - $767,000
--
Bed
3
Baths
3,131
Sq Ft
$202/Sq Ft
Est. Value
About This Home
This home is located at 106 Hideaway Hills Place, Hot Springs National Park, AR 71901 and is currently estimated at $633,687, approximately $202 per square foot. 106 Hideaway Hills Place is a home located in Garland County with nearby schools including Lakeside Primary School, Lakeside Intermediate School, and Lakeside Middle School.
Ownership History
Date
Name
Owned For
Owner Type
Purchase Details
Closed on
Nov 20, 2020
Sold by
Chriss Brian D
Bought by
Ross Amy B and Ross Howard J
Current Estimated Value
Home Financials for this Owner
Home Financials are based on the most recent Mortgage that was taken out on this home.
Original Mortgage
$383,200
Outstanding Balance
$340,215
Interest Rate
2.8%
Mortgage Type
New Conventional
Estimated Equity
$293,472
Purchase Details
Closed on
Nov 15, 2016
Sold by
Tullos Olivia Paul and Tullos Olivia Paul
Bought by
Chriss Brian and Chriss Tina
Purchase Details
Closed on
Apr 30, 2010
Sold by
Kelso Kenneth P and Kelso Kim H
Bought by
Tullos Malcolm Madric and Tullos Olivia Paul
Purchase Details
Closed on
May 11, 1990
Sold by
Not Provided
Bought by
Miller William C Independent
Create a Home Valuation Report for This Property
The Home Valuation Report is an in-depth analysis detailing your home's value as well as a comparison with similar homes in the area
Home Values in the Area
Average Home Value in this Area
Purchase History
| Date | Buyer | Sale Price | Title Company |
|---|---|---|---|
| Ross Amy B | -- | Lenders Title Company | |
| Ross Amy B | $479,000 | Lenders Title Company | |
| Ross Amy B | -- | Lenders Title Company | |
| Chriss Brian | $365,000 | Garland County Title | |
| Tullos Malcolm Madric | $251,000 | Garland County Title Company | |
| Miller William C Independent | $7,000 | -- | |
| Miller William C Independent | $7,000 | -- |
Source: Public Records
Mortgage History
| Date | Status | Borrower | Loan Amount |
|---|---|---|---|
| Open | Ross Amy B | $383,200 | |
| Closed | Ross Amy B | $383,200 |
Source: Public Records
Tax History Compared to Growth
Tax History
| Year | Tax Paid | Tax Assessment Tax Assessment Total Assessment is a certain percentage of the fair market value that is determined by local assessors to be the total taxable value of land and additions on the property. | Land | Improvement |
|---|---|---|---|---|
| 2025 | $3,535 | $90,870 | $15,670 | $75,200 |
| 2024 | $3,552 | $90,870 | $15,670 | $75,200 |
| 2023 | $3,891 | $90,870 | $15,670 | $75,200 |
| 2022 | $3,675 | $90,870 | $15,670 | $75,200 |
| 2021 | $3,341 | $71,540 | $15,400 | $56,140 |
| 2020 | $2,966 | $71,540 | $15,400 | $56,140 |
| 2019 | $2,866 | $71,540 | $15,400 | $56,140 |
| 2018 | $2,991 | $71,540 | $15,400 | $56,140 |
| 2017 | $2,605 | $71,540 | $15,400 | $56,140 |
| 2016 | $3,053 | $82,400 | $20,720 | $61,680 |
| 2015 | $3,053 | $82,400 | $20,720 | $61,680 |
| 2014 | $3,053 | $82,400 | $20,720 | $61,680 |
Source: Public Records
Map
Nearby Homes
- 132 Victoria Ln
- 195 Windsong Bay Dr
- LOT 42 Windsong Bay Dr
- LOT 43 Windsong Bay Dr
- Lots 45&46 Windsong Bay Dr
- LOT 44 Windsong Bay Dr
- 105 Flintwood Ct
- 28 Edgemont Dr
- 28A Edgemont Dr
- 21 Springbrook Dr
- 249 Springbrook Dr
- Lot 1092 Cedar Hill Dr
- 203 Merganser Trail
- 207 Merganser Trail
- 110 Circle r Ct
- 343 Arlington Point
- Lot 859 Morningside Dr
- 220 Chadwood St
- 106 Hideaway Hills Place
- 0 Hideaway Hills Place Unit 16021695
- 0 Hideaway Hills Place Unit 20028107
- 0 Hireaway Hills Place Unit 20033524
- 107 Hideaway Hills Place
- 108 Hideaway Hills Place
- 111 Hideaway Hills Ct
- 440 Hideaway Hills Dr
- 440 Hideaway Hills Dr
- 167 Windsong Bay Dr
- 129 Hideaway Hills Dr
- 424 Hideaway Hills Dr
- 412 Hideaway Hills Dr
- 195 Windsong Terrace
- 422 Hideaway Hills Dr
- 403 Hideaway Hills Dr
- 193 Windsong Terrace
- 193 Windsong Terrace
- 197 Windsong Terrace
- 197 Windsong Terrace