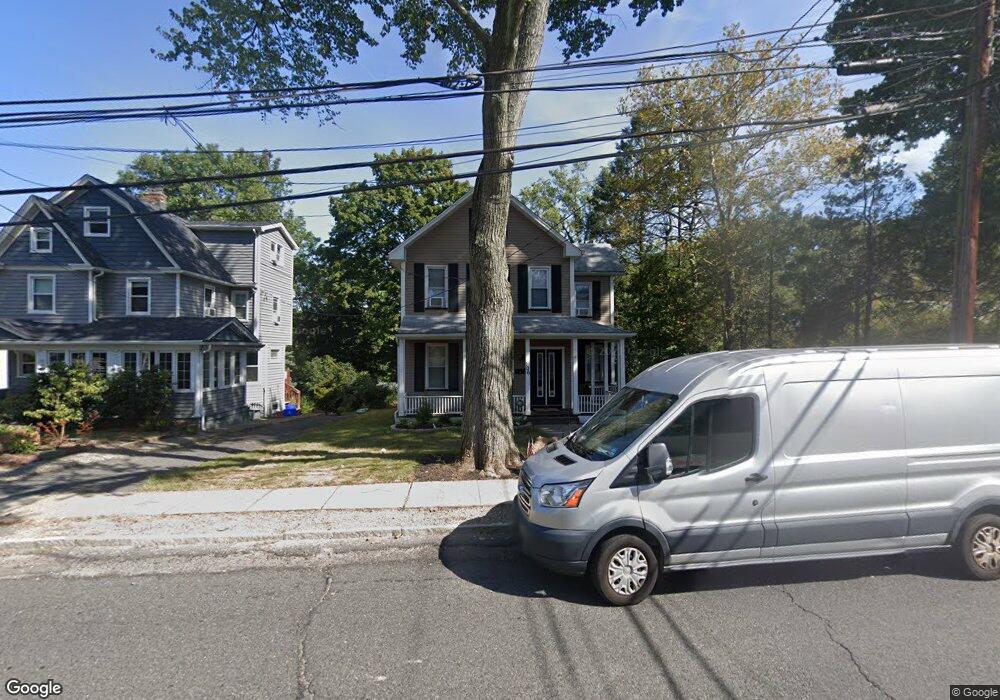
106 High St Unit 2 Nutley, NJ 07110
Estimated Value: $665,000 - $793,000
2
Beds
1
Bath
1,824
Sq Ft
$400/Sq Ft
Est. Value
About This Home
This home is located at 106 High St Unit 2, Nutley, NJ 07110 and is currently estimated at $730,351, approximately $400 per square foot. 106 High St Unit 2 is a home located in Essex County with nearby schools including Nutley High School, St Clare Elementary School, and St Thomas The Apostle School.
Ownership History
Date
Name
Owned For
Owner Type
Purchase Details
Closed on
Nov 26, 2017
Sold by
Misner Gary W Sr Est
Bought by
Misner Greg
Current Estimated Value
Home Financials for this Owner
Home Financials are based on the most recent Mortgage that was taken out on this home.
Original Mortgage
$305,250
Interest Rate
3.99%
Mortgage Type
FHA
Purchase Details
Closed on
Aug 3, 2009
Sold by
Misner Gary W and Misner Richard
Bought by
Misner Cary W and Misner Gary W
Home Financials for this Owner
Home Financials are based on the most recent Mortgage that was taken out on this home.
Original Mortgage
$210,000
Interest Rate
5.36%
Mortgage Type
New Conventional
Create a Home Valuation Report for This Property
The Home Valuation Report is an in-depth analysis detailing your home's value as well as a comparison with similar homes in the area
Home Values in the Area
Average Home Value in this Area
Purchase History
| Date | Buyer | Sale Price | Title Company |
|---|---|---|---|
| Misner Greg | -- | -- | |
| Misner Cary W | $300,000 | Ticor Title Insurance Co |
Source: Public Records
Mortgage History
| Date | Status | Borrower | Loan Amount |
|---|---|---|---|
| Previous Owner | Misner Greg | $305,250 | |
| Previous Owner | Misner Cary W | $210,000 |
Source: Public Records
Tax History
| Year | Tax Paid | Tax Assessment Tax Assessment Total Assessment is a certain percentage of the fair market value that is determined by local assessors to be the total taxable value of land and additions on the property. | Land | Improvement |
|---|---|---|---|---|
| 2025 | $14,287 | $554,600 | $250,400 | $304,200 |
| 2024 | $14,287 | $554,600 | $250,400 | $304,200 |
| 2022 | $13,671 | $353,800 | $183,900 | $169,900 |
| 2021 | $13,600 | $353,800 | $183,900 | $169,900 |
| 2020 | $13,027 | $353,800 | $183,900 | $169,900 |
| 2019 | $12,765 | $353,800 | $183,900 | $169,900 |
| 2018 | $12,422 | $353,800 | $183,900 | $169,900 |
| 2017 | $12,287 | $353,800 | $183,900 | $169,900 |
| 2016 | $11,923 | $353,800 | $183,900 | $169,900 |
| 2015 | $11,732 | $353,800 | $183,900 | $169,900 |
| 2014 | $11,583 | $353,800 | $183,900 | $169,900 |
Source: Public Records
Map
Nearby Homes
- 41 High St
- 225 Hillside Ave
- 723 Bloomfield Ave
- 741 Bloomfield Ave
- 31 Emily Ave
- 585 Bloomfield Ave
- 93 Glendale St
- 50 Beech St
- 37 Jackson St
- 19 Glendale St
- 612 Passaic Ave
- 688 Passaic Ave
- 80 Rhoda Ave
- 238 Rutgers Place
- 63 Lakeside Dr
- 355 W Passaic Ave
- 1 Rutan Place
- 93 Bromley Place
- 18 Farmingdale Ave
- 330 W Passaic Ave
Your Personal Tour Guide
Ask me questions while you tour the home.