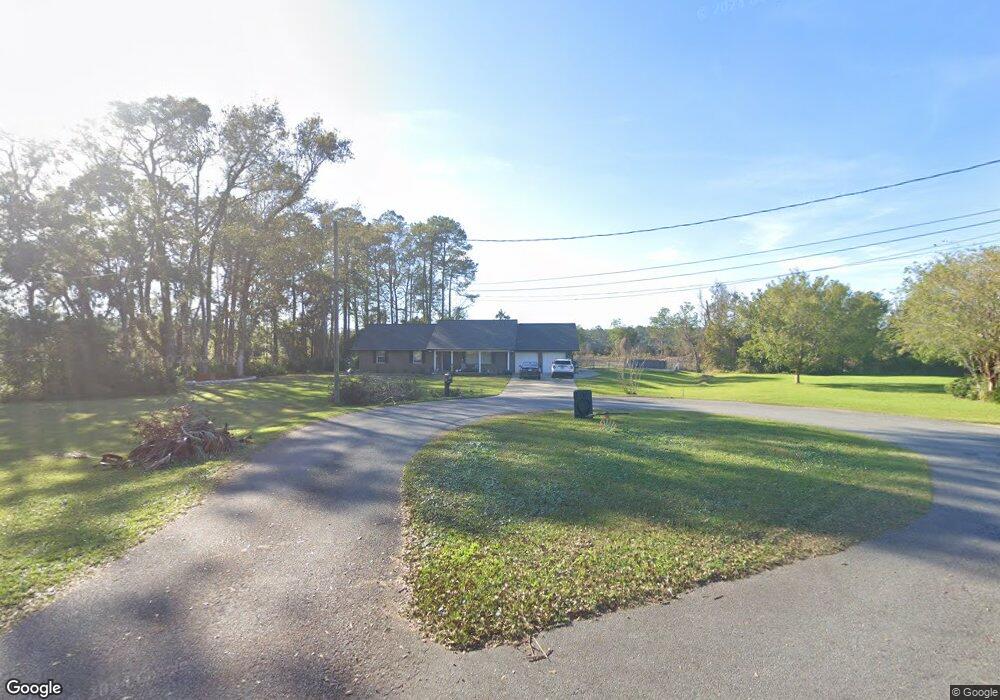
106 Honey Bee Brunswick, GA 31525
Estimated Value: $285,000 - $332,000
3
Beds
2
Baths
1,819
Sq Ft
$174/Sq Ft
Est. Value
About This Home
This home is located at 106 Honey Bee, Brunswick, GA 31525 and is currently estimated at $316,896, approximately $174 per square foot. 106 Honey Bee is a home located in Glynn County with nearby schools including Greer Elementary School, Needwood Middle School, and Brunswick High School.
Ownership History
Date
Name
Owned For
Owner Type
Purchase Details
Closed on
Aug 8, 2025
Sold by
Sutherland Torii C
Bought by
Kearns John R and Kearns Melisa A
Current Estimated Value
Home Financials for this Owner
Home Financials are based on the most recent Mortgage that was taken out on this home.
Original Mortgage
$327,361
Outstanding Balance
$327,077
Interest Rate
6.72%
Mortgage Type
New Conventional
Estimated Equity
-$10,181
Purchase Details
Closed on
Jan 19, 2023
Sold by
Chockley Jeffrey A
Bought by
Sutherland Torrii C
Home Financials for this Owner
Home Financials are based on the most recent Mortgage that was taken out on this home.
Original Mortgage
$225,000
Interest Rate
6.27%
Mortgage Type
VA
Purchase Details
Closed on
Oct 10, 2014
Sold by
Pollard Joseph P
Bought by
Chockley Jeffrey A
Home Financials for this Owner
Home Financials are based on the most recent Mortgage that was taken out on this home.
Original Mortgage
$117,335
Interest Rate
4.4%
Mortgage Type
FHA
Create a Home Valuation Report for This Property
The Home Valuation Report is an in-depth analysis detailing your home's value as well as a comparison with similar homes in the area
Home Values in the Area
Average Home Value in this Area
Purchase History
| Date | Buyer | Sale Price | Title Company |
|---|---|---|---|
| Kearns John R | $333,400 | -- | |
| Sutherland Torrii C | $225,000 | -- | |
| Chockley Jeffrey A | $119,500 | -- |
Source: Public Records
Mortgage History
| Date | Status | Borrower | Loan Amount |
|---|---|---|---|
| Open | Kearns John R | $327,361 | |
| Previous Owner | Sutherland Torrii C | $225,000 | |
| Previous Owner | Chockley Jeffrey A | $117,335 |
Source: Public Records
Tax History Compared to Growth
Tax History
| Year | Tax Paid | Tax Assessment Tax Assessment Total Assessment is a certain percentage of the fair market value that is determined by local assessors to be the total taxable value of land and additions on the property. | Land | Improvement |
|---|---|---|---|---|
| 2025 | $2,617 | $104,360 | $10,000 | $94,360 |
| 2024 | $2,229 | $88,880 | $5,600 | $83,280 |
| 2023 | $1,394 | $51,640 | $5,600 | $46,040 |
| 2022 | $1,404 | $51,000 | $4,960 | $46,040 |
| 2021 | $1,425 | $50,280 | $4,960 | $45,320 |
| 2020 | $1,438 | $50,280 | $4,960 | $45,320 |
| 2019 | $1,438 | $50,280 | $4,960 | $45,320 |
| 2018 | $1,438 | $50,280 | $4,960 | $45,320 |
| 2017 | $1,438 | $50,280 | $4,960 | $45,320 |
| 2016 | $1,332 | $50,280 | $4,960 | $45,320 |
| 2015 | $1,193 | $47,800 | $4,960 | $42,840 |
| 2014 | $1,193 | $50,280 | $4,960 | $45,320 |
Source: Public Records
Map
Nearby Homes
- 103 Cooper Cir
- 211 N Deerfield Dr
- 213 N Deerfield Dr
- 109 Willow Pond Way
- 138 Thornhill Dr
- 11 Hidden Harbor Rd
- 110 Thornhill Dr
- 16 Hidden Harbor Rd
- 118 Drayton Cir
- 203 Willow Pond Way
- 131 Drayton Cir
- 60 Powers Landing
- 61 Quail Ridge Rd
- 200 Drayton Cir
- 4548 U S 17
- 171 Drayton Cir
- 6 Quail Run
- 101 Winton Dr
- 115 Winton Dr
- 236 Enterprise St
- 107 Honeybee Ln
- 10 Tuya Ln
- 104 Honeybee Ln
- 105 Honeybee Ln
- 0 Honeybee Ln
- 102 Honeybee Ln
- 4371 Us Highway 17 N
- 20 Tuya Ln
- 103 Honeybee Ln
- 106110114 Stuart Rd
- 4339 Us Highway 17 N
- 100 Honeybee Ln
- 101 Honeybee Ln
- 4381 Us Highway 17 N
- 4385 Us Highway 17 N
- 4381 Us Highway 17 N
- 4373 & 4375 Highway 17 N
- 1000 Glynn Park Rd
- 4360 Us Highway 17 N
- 4376 Us Highway 17 N