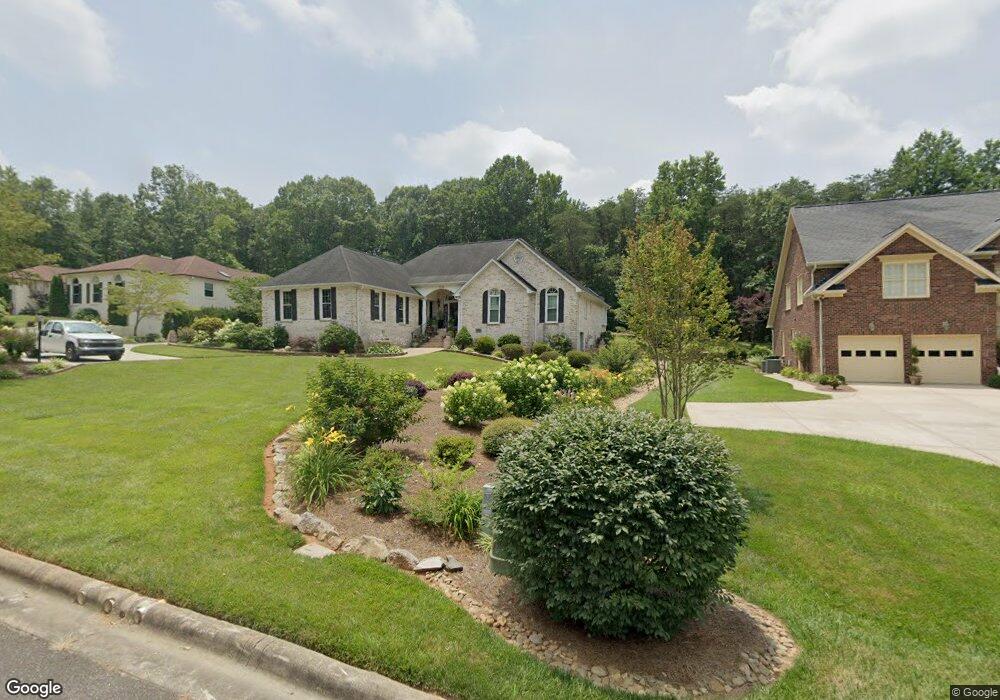
106 Jason Dr Kings Mountain, NC 28086
Estimated Value: $379,473 - $465,000
--
Bed
--
Bath
2,291
Sq Ft
$188/Sq Ft
Est. Value
About This Home
This home is located at 106 Jason Dr, Kings Mountain, NC 28086 and is currently estimated at $430,618, approximately $187 per square foot. 106 Jason Dr is a home located in Cleveland County with nearby schools including North Elementary School, Kings Mountain Intermediate School, and Kings Mountain Middle.
Create a Home Valuation Report for This Property
The Home Valuation Report is an in-depth analysis detailing your home's value as well as a comparison with similar homes in the area
Home Values in the Area
Average Home Value in this Area
Tax History Compared to Growth
Tax History
| Year | Tax Paid | Tax Assessment Tax Assessment Total Assessment is a certain percentage of the fair market value that is determined by local assessors to be the total taxable value of land and additions on the property. | Land | Improvement |
|---|---|---|---|---|
| 2025 | $4,096 | $399,636 | $36,630 | $363,006 |
| 2024 | $2,998 | $254,610 | $27,472 | $227,138 |
| 2023 | $2,983 | $254,610 | $27,472 | $227,138 |
| 2022 | $2,856 | $254,610 | $27,472 | $227,138 |
| 2021 | $2,870 | $254,610 | $27,472 | $227,138 |
| 2020 | $2,346 | $202,053 | $22,661 | $179,392 |
| 2019 | $2,346 | $202,053 | $22,661 | $179,392 |
| 2018 | $2,344 | $202,053 | $22,661 | $179,392 |
| 2017 | $2,333 | $202,053 | $22,661 | $179,392 |
| 2016 | $2,342 | $202,053 | $22,661 | $179,392 |
| 2015 | $2,261 | $200,206 | $19,536 | $180,670 |
| 2014 | $2,261 | $200,206 | $19,536 | $180,670 |
Source: Public Records
Map
Nearby Homes
- 521 Coman Ln
- 1417 Merrimont Ave
- 117 Parker Claire Ln
- 111 Parker Claire Ln
- 213 Parker Claire Ln
- 1500 Shelby Rd
- 1610 Shelby Rd
- 1427 Merrimont Ave
- 1301 Shelby Rd
- 208 Victoria Cir
- 155 Patterson Rd
- 145 Crown Ct
- 167 Patterson Rd
- 442 Phifer Rd
- Plan 2338 at Cottages at Clovis Point
- Plan 2723 at Cottages at Clovis Point
- Plan 2539 at Cottages at Clovis Point
- Plan 1844 at Cottages at Clovis Point
- Plan 1445 at Cottages at Clovis Point
- Plan 1582 at Cottages at Clovis Point
- 108 Jason Dr
- 104 Jason Dr
- 102 Jason Dr
- 511 Deerfield Dr
- 110 Jason Dr
- 109 Jason Dr
- 100 Jason Dr
- 509 Deerfield Dr
- 112 Jason Dr
- 514 Deerfield Dr
- 113 Jason Dr
- 507 Deerfield Dr
- 512 Deerfield Dr
- 505 Deerfield Dr
- 311 Churchill Dr
- 508 Deerfield Dr
- 310 Woodhaven Ln
- 307 Churchill Dr
- 539 Coman Ln Unit Lot 9
- 313 Churchill Dr