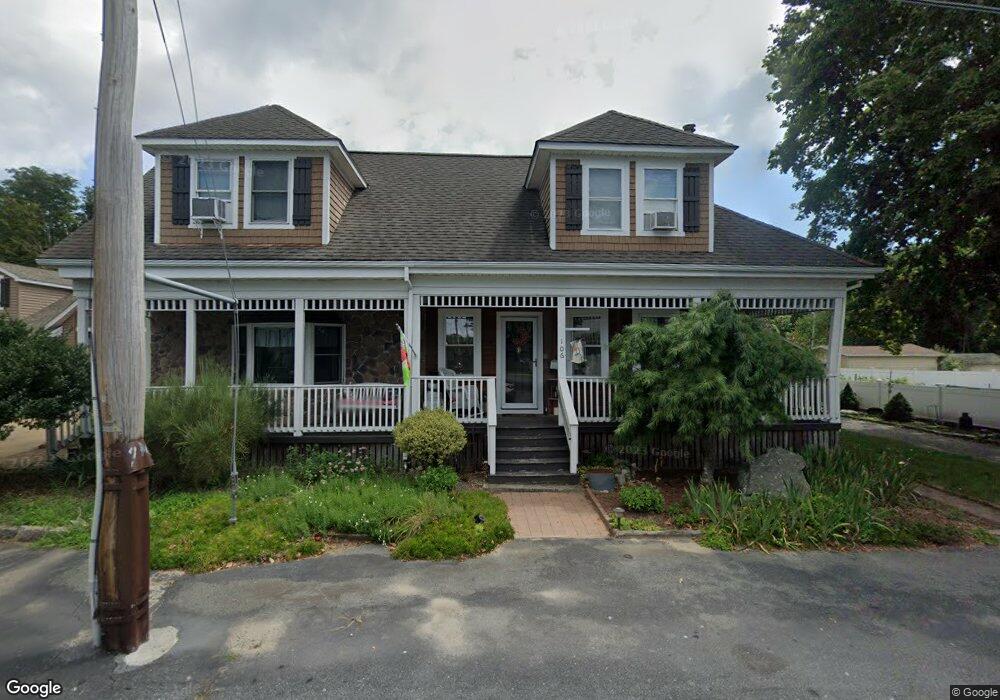
106 John St Acushnet, MA 02743
Estimated Value: $475,000 - $558,562
3
Beds
2
Baths
1,503
Sq Ft
$339/Sq Ft
Est. Value
About This Home
This home is located at 106 John St, Acushnet, MA 02743 and is currently estimated at $509,141, approximately $338 per square foot. 106 John St is a home located in Bristol County with nearby schools including Acushnet Elementary School, Albert F Ford Middle School, and Alma Del Mar Charter School.
Ownership History
Date
Name
Owned For
Owner Type
Purchase Details
Closed on
Jun 6, 2019
Sold by
Leblanc Paul R and Leblanc Gale R
Bought by
Gpkm 106 Nt and Leblanc
Current Estimated Value
Purchase Details
Closed on
Feb 26, 1992
Sold by
Gagnon Edward E
Bought by
Leblanc Paul R and Brown Gale R
Create a Home Valuation Report for This Property
The Home Valuation Report is an in-depth analysis detailing your home's value as well as a comparison with similar homes in the area
Home Values in the Area
Average Home Value in this Area
Purchase History
| Date | Buyer | Sale Price | Title Company |
|---|---|---|---|
| Gpkm 106 Nt | -- | -- | |
| Leblanc Paul R | $94,300 | -- |
Source: Public Records
Mortgage History
| Date | Status | Borrower | Loan Amount |
|---|---|---|---|
| Previous Owner | Leblanc Paul R | $100,000 | |
| Previous Owner | Leblanc Paul R | $126,000 | |
| Previous Owner | Leblanc Paul R | $130,000 |
Source: Public Records
Tax History
| Year | Tax Paid | Tax Assessment Tax Assessment Total Assessment is a certain percentage of the fair market value that is determined by local assessors to be the total taxable value of land and additions on the property. | Land | Improvement |
|---|---|---|---|---|
| 2025 | $48 | $445,600 | $99,800 | $345,800 |
| 2024 | $4,619 | $404,800 | $95,500 | $309,300 |
| 2023 | $4,406 | $367,200 | $86,800 | $280,400 |
| 2022 | $4,378 | $329,900 | $82,500 | $247,400 |
| 2021 | $4,173 | $301,700 | $82,500 | $219,200 |
| 2020 | $4,206 | $301,700 | $82,500 | $219,200 |
| 2019 | $3,977 | $280,500 | $82,500 | $198,000 |
| 2018 | $4,045 | $280,500 | $82,500 | $198,000 |
| 2017 | $3,858 | $267,200 | $82,500 | $184,700 |
| 2016 | $3,871 | $266,400 | $82,500 | $183,900 |
| 2015 | $3,680 | $257,700 | $82,500 | $175,200 |
Source: Public Records
Map
Nearby Homes
- 14 Hayes St Unit 1
- 12 Hayes St Unit 1
- 12 White St
- 11 Boylston St
- 0 Hathaway Rd Unit 73469544
- 91 S Main St
- 23 Oliveira Ave
- 122 Truro St
- 25 Pershing Ave
- 81 Sylvia St
- 112 Lawson Ave
- 20 Jake Ln
- 4 Sam St
- 34 Chicopee St
- 5 William St
- 14 Caswell St
- 27 Meadow Ln
- 15 Ball St
- 1940-1942 Acushnet Ave
- 65 Armsby St
Your Personal Tour Guide
Ask me questions while you tour the home.