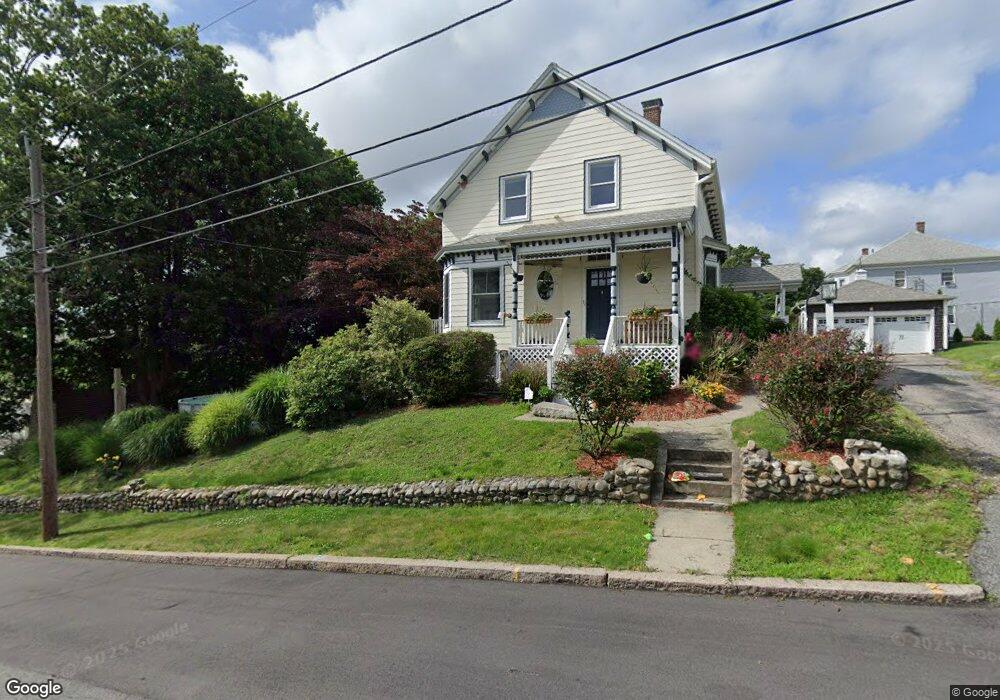
106 Jones St Fall River, MA 02720
Western Fall River NeighborhoodEstimated Value: $375,000 - $428,000
3
Beds
2
Baths
1,523
Sq Ft
$261/Sq Ft
Est. Value
About This Home
This home is located at 106 Jones St, Fall River, MA 02720 and is currently estimated at $397,584, approximately $261 per square foot. 106 Jones St is a home located in Bristol County with nearby schools including North End Elementary School, Morton Middle School, and B M C Durfee High School.
Ownership History
Date
Name
Owned For
Owner Type
Purchase Details
Closed on
Jun 30, 2015
Sold by
Palmer Keith N and Palmer June M
Bought by
Palmer Keith N
Current Estimated Value
Purchase Details
Closed on
Feb 19, 1998
Sold by
Obrien Agnes E Est
Bought by
Palmer Keith N and Palmer June M
Home Financials for this Owner
Home Financials are based on the most recent Mortgage that was taken out on this home.
Original Mortgage
$70,200
Interest Rate
6.9%
Mortgage Type
Purchase Money Mortgage
Create a Home Valuation Report for This Property
The Home Valuation Report is an in-depth analysis detailing your home's value as well as a comparison with similar homes in the area
Home Values in the Area
Average Home Value in this Area
Purchase History
| Date | Buyer | Sale Price | Title Company |
|---|---|---|---|
| Palmer Keith N | -- | -- | |
| Palmer Keith N | $78,000 | -- |
Source: Public Records
Mortgage History
| Date | Status | Borrower | Loan Amount |
|---|---|---|---|
| Previous Owner | Palmer Keith N | $72,000 | |
| Previous Owner | Palmer Keith N | $20,000 | |
| Previous Owner | Palmer Keith N | $70,200 |
Source: Public Records
Tax History Compared to Growth
Tax History
| Year | Tax Paid | Tax Assessment Tax Assessment Total Assessment is a certain percentage of the fair market value that is determined by local assessors to be the total taxable value of land and additions on the property. | Land | Improvement |
|---|---|---|---|---|
| 2025 | $3,686 | $321,900 | $128,000 | $193,900 |
| 2024 | $3,507 | $305,200 | $125,500 | $179,700 |
| 2023 | $3,324 | $270,900 | $113,100 | $157,800 |
| 2022 | $3,127 | $247,800 | $106,700 | $141,100 |
| 2021 | $2,924 | $211,400 | $101,900 | $109,500 |
| 2020 | $2,870 | $198,600 | $97,300 | $101,300 |
| 2019 | $2,881 | $197,600 | $101,600 | $96,000 |
| 2018 | $2,820 | $192,900 | $102,400 | $90,500 |
| 2017 | $2,689 | $192,100 | $102,400 | $89,700 |
| 2016 | $2,602 | $190,900 | $105,500 | $85,400 |
| 2015 | $2,497 | $190,900 | $105,500 | $85,400 |
| 2014 | $2,402 | $190,900 | $105,500 | $85,400 |
Source: Public Records
Map
Nearby Homes
- 195 Crescent St Unit 2
- 122 Stowe St Unit 122
- 120 Stowe St Unit 120
- 1928 N Main St Unit 4
- 29 Valentine St
- 110 Stowe St Unit 110
- 108 Stowe St Unit 108
- 409 Crescent St
- 203 Martha St
- 1247 Highland Ave
- 333 Langley St
- 1810 Highland Ave Unit 22
- 208 Florence St
- 26 Goddard St
- 247 Albany St
- 1556 N Main St Unit 7
- 274 Archer St
- 160 Stewart St
- 303 Florence St
- 172 Gibbs St