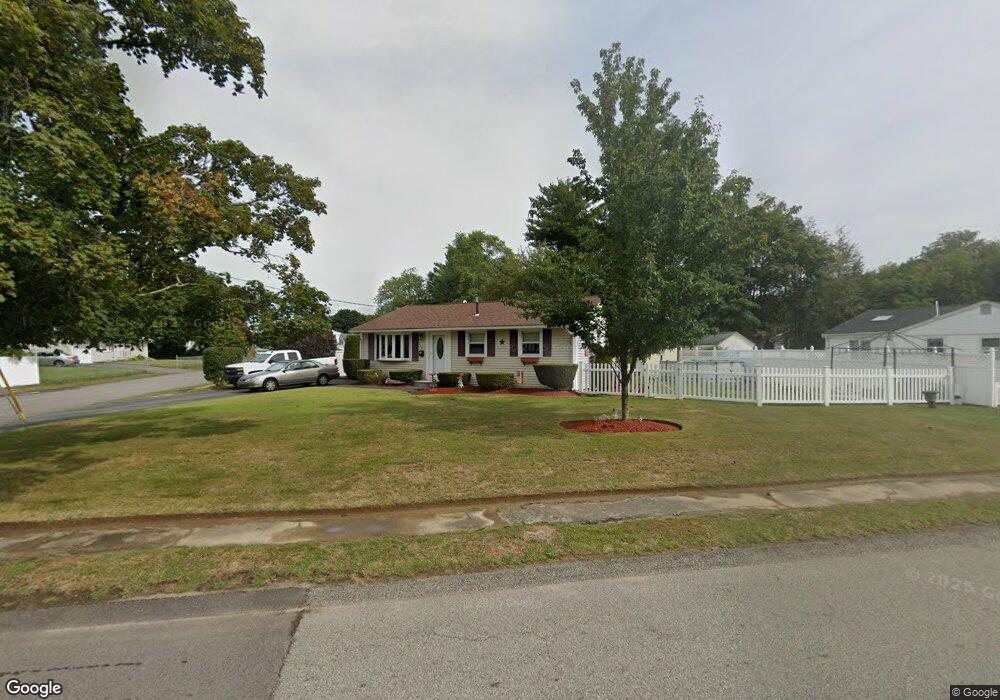
106 Josh Gray Rd Rockland, MA 02370
Estimated Value: $404,000 - $497,521
3
Beds
1
Bath
1,152
Sq Ft
$405/Sq Ft
Est. Value
About This Home
This home is located at 106 Josh Gray Rd, Rockland, MA 02370 and is currently estimated at $466,380, approximately $404 per square foot. 106 Josh Gray Rd is a home located in Plymouth County with nearby schools including Rockland Senior High School, Calvary Chapel Academy, and Holy Family Elementary School.
Ownership History
Date
Name
Owned For
Owner Type
Purchase Details
Closed on
Oct 2, 2007
Sold by
Collins Sean P and Collins Stacy
Bought by
Lazisky Ronald W and Budrick Jillian L
Current Estimated Value
Home Financials for this Owner
Home Financials are based on the most recent Mortgage that was taken out on this home.
Original Mortgage
$261,000
Outstanding Balance
$165,168
Interest Rate
6.65%
Mortgage Type
Purchase Money Mortgage
Estimated Equity
$301,212
Purchase Details
Closed on
May 16, 2006
Sold by
Collins Stacy and Goodale Stacy
Bought by
Collins Stacy and Collins Sean P
Purchase Details
Closed on
May 21, 1999
Sold by
Landrey James A and Landrey Diane
Bought by
Stowell Robert and Seelye Terrie L
Purchase Details
Closed on
Aug 10, 1995
Sold by
Maroney Kevin B and Maroney Charlene M
Bought by
Landrey James A
Create a Home Valuation Report for This Property
The Home Valuation Report is an in-depth analysis detailing your home's value as well as a comparison with similar homes in the area
Home Values in the Area
Average Home Value in this Area
Purchase History
| Date | Buyer | Sale Price | Title Company |
|---|---|---|---|
| Lazisky Ronald W | $261,000 | -- | |
| Collins Stacy | -- | -- | |
| Stowell Robert | $149,900 | -- | |
| Landrey James A | $95,000 | -- |
Source: Public Records
Mortgage History
| Date | Status | Borrower | Loan Amount |
|---|---|---|---|
| Open | Landrey James A | $261,000 | |
| Previous Owner | Landrey James A | $56,000 |
Source: Public Records
Tax History Compared to Growth
Tax History
| Year | Tax Paid | Tax Assessment Tax Assessment Total Assessment is a certain percentage of the fair market value that is determined by local assessors to be the total taxable value of land and additions on the property. | Land | Improvement |
|---|---|---|---|---|
| 2025 | $5,378 | $393,400 | $224,700 | $168,700 |
| 2024 | $5,220 | $371,300 | $212,000 | $159,300 |
| 2023 | $5,187 | $340,800 | $194,500 | $146,300 |
| 2022 | $4,966 | $296,500 | $169,100 | $127,400 |
| 2021 | $10,272 | $264,400 | $153,700 | $110,700 |
| 2020 | $4,407 | $251,800 | $146,400 | $105,400 |
| 2019 | $4,301 | $240,000 | $139,400 | $100,600 |
| 2018 | $4,021 | $220,700 | $139,400 | $81,300 |
| 2017 | $26,151 | $213,400 | $139,400 | $74,000 |
| 2016 | $3,789 | $204,900 | $134,100 | $70,800 |
| 2015 | $3,591 | $188,700 | $125,300 | $63,400 |
| 2014 | $3,413 | $186,100 | $122,900 | $63,200 |
Source: Public Records
Map
Nearby Homes