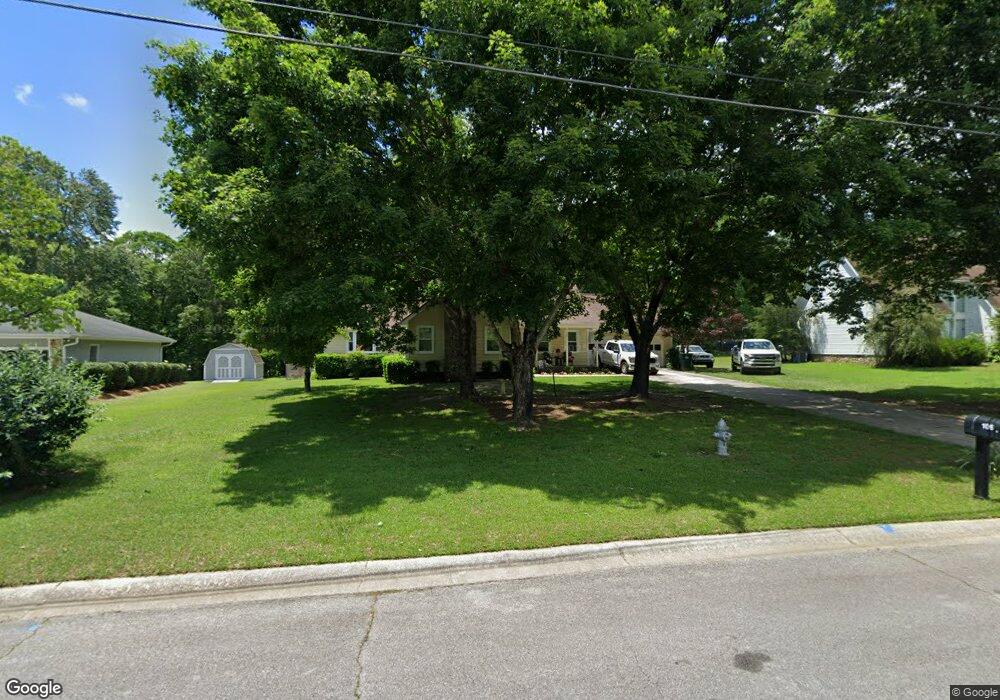
106 Lake Terrace Ct Carrollton, GA 30117
Estimated Value: $293,437 - $346,000
4
Beds
2
Baths
1,944
Sq Ft
$165/Sq Ft
Est. Value
About This Home
This home is located at 106 Lake Terrace Ct, Carrollton, GA 30117 and is currently estimated at $321,359, approximately $165 per square foot. 106 Lake Terrace Ct is a home located in Carroll County with nearby schools including Carrollton Elementary School, Carrollton Upper Elementary School, and Carrollton Middle School.
Ownership History
Date
Name
Owned For
Owner Type
Purchase Details
Closed on
Mar 23, 2021
Sold by
Hanson Jan Bostwick
Bought by
Hanson Jan Bostwick and Hanson Billy Lee
Current Estimated Value
Purchase Details
Closed on
Jan 28, 2009
Sold by
Marlow Jeffrey L
Bought by
Marlow Janet B
Purchase Details
Closed on
Apr 28, 2000
Sold by
Bass Joseph A
Bought by
Marlow Jeff L and Marlow Jan B
Purchase Details
Closed on
Aug 25, 1995
Sold by
Chester Paul B and Chester Judith C
Bought by
Bass Joseph A
Purchase Details
Closed on
May 27, 1993
Sold by
House John C Jr & Valerie P
Bought by
Chester Paul B and Chester Judith C
Purchase Details
Closed on
Jun 1, 1984
Sold by
Wallace Inez A
Bought by
House John C Jr & Valerie P
Purchase Details
Closed on
Dec 1, 1979
Sold by
Steadham W Douglas
Bought by
Wallace Inez A
Purchase Details
Closed on
Mar 1, 1979
Sold by
Agan A V Etal
Bought by
Steadham W Douglas
Create a Home Valuation Report for This Property
The Home Valuation Report is an in-depth analysis detailing your home's value as well as a comparison with similar homes in the area
Home Values in the Area
Average Home Value in this Area
Purchase History
| Date | Buyer | Sale Price | Title Company |
|---|---|---|---|
| Hanson Jan Bostwick | -- | -- | |
| Marlow Janet B | -- | -- | |
| Marlow Jeff L | $129,500 | -- | |
| Bass Joseph A | $95,000 | -- | |
| Chester Paul B | $95,000 | -- | |
| House John C Jr & Valerie P | $72,900 | -- | |
| Wallace Inez A | $6,500 | -- | |
| Steadham W Douglas | $8,500 | -- |
Source: Public Records
Tax History Compared to Growth
Tax History
| Year | Tax Paid | Tax Assessment Tax Assessment Total Assessment is a certain percentage of the fair market value that is determined by local assessors to be the total taxable value of land and additions on the property. | Land | Improvement |
|---|---|---|---|---|
| 2024 | $760 | $100,002 | $13,200 | $86,802 |
| 2023 | $744 | $92,066 | $13,200 | $78,866 |
| 2022 | $750 | $76,470 | $13,200 | $63,270 |
| 2021 | $1,967 | $67,393 | $13,200 | $54,193 |
| 2020 | $1,809 | $61,904 | $13,200 | $48,704 |
| 2019 | $1,720 | $58,319 | $13,200 | $45,119 |
| 2018 | $1,601 | $53,494 | $13,200 | $40,294 |
| 2017 | $1,609 | $53,494 | $13,200 | $40,294 |
| 2016 | $1,618 | $53,494 | $13,200 | $40,294 |
| 2015 | $1,352 | $43,769 | $10,000 | $33,770 |
| 2014 | $1,358 | $43,770 | $10,000 | $33,770 |
Source: Public Records
Map
Nearby Homes
- 231 N Lakeshore Dr
- 105 Providence Ct
- 223 N Lakeshore Dr
- 131 Hunter Way
- 221 Turtle Cove
- 2580 Shady Grove Rd
- 255 Morgan Rd
- 121 Wilson Cir
- 211 Greystone Dr
- The McGinnis Plan at Morgan Landing
- 3 Burns Rd
- 2 Burns Rd
- 816 Stewart St
- 325 Almon Rd
- 0 Carroll Cir- Lots 4-8 Unit 148012
- 1711B Bankhead Hwy
- 111 Lakeview Dr
- 114 Green Point Way
- 204 Burns Rd
- 150 Cedar Park Way
- 107 Lake Terrace Ct
- 103 Lake Terrace Ct
- 109 Lake Terrace Ct
- 115 Northlake Dr
- 115 N Lake Dr
- 111 Northlake Dr
- 104 Lake Terrace Ct
- 105 Lake Terrace Ct
- 117 Northlake Dr
- 108 Lake Terrace Ct
- 108 Wellington Ct
- 121 Northlake Dr
- 111 Lake Terrace Ct
- 111 Lake Terrace Ct Unit 17
- 110 Lake Terrace Ct
- 118 Northlake Dr
- 109 N Lake Dr
- 116 Northlake Dr
- 109 Northlake Dr
- 120 N Lake Dr