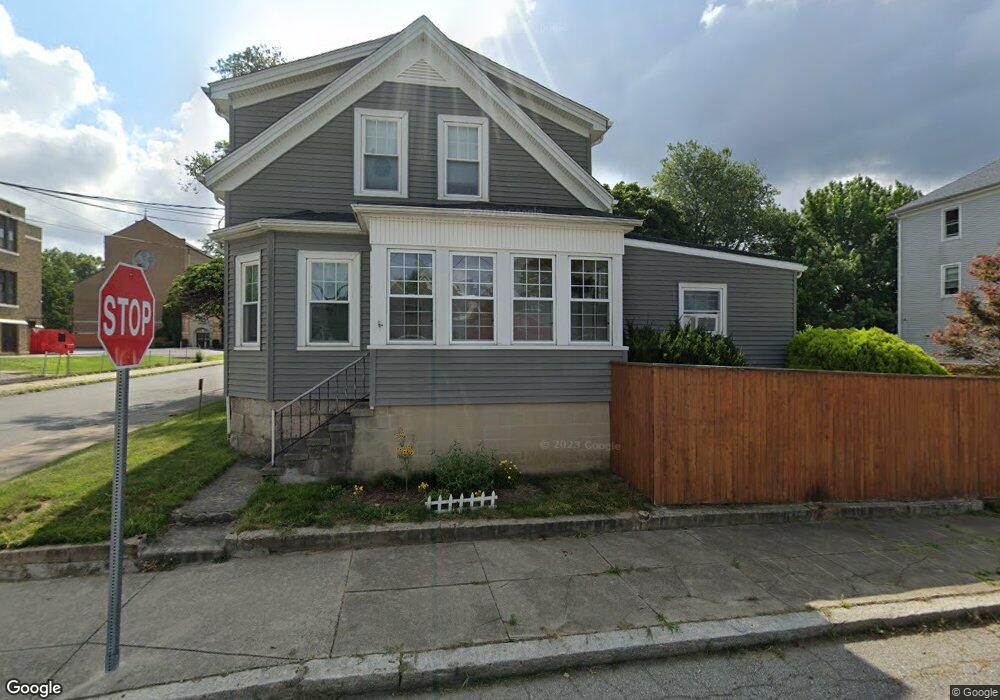
106 Lamphor St Fall River, MA 02721
Maplewood NeighborhoodEstimated Value: $430,000 - $477,000
3
Beds
3
Baths
2,107
Sq Ft
$215/Sq Ft
Est. Value
About This Home
This home is located at 106 Lamphor St, Fall River, MA 02721 and is currently estimated at $452,876, approximately $214 per square foot. 106 Lamphor St is a home located in Bristol County with nearby schools including Letourneau Elementary School, Matthew J. Kuss Middle School, and B M C Durfee High School.
Ownership History
Date
Name
Owned For
Owner Type
Purchase Details
Closed on
Feb 26, 1999
Sold by
Picard Raymond V and Picard Esther R
Bought by
Medeiros Joan M
Current Estimated Value
Home Financials for this Owner
Home Financials are based on the most recent Mortgage that was taken out on this home.
Original Mortgage
$103,500
Interest Rate
6.78%
Mortgage Type
Purchase Money Mortgage
Create a Home Valuation Report for This Property
The Home Valuation Report is an in-depth analysis detailing your home's value as well as a comparison with similar homes in the area
Home Values in the Area
Average Home Value in this Area
Purchase History
| Date | Buyer | Sale Price | Title Company |
|---|---|---|---|
| Medeiros Joan M | $115,000 | -- |
Source: Public Records
Mortgage History
| Date | Status | Borrower | Loan Amount |
|---|---|---|---|
| Open | Medeiros Joan M | $183,000 | |
| Closed | Medeiros Joan M | $104,650 | |
| Closed | Medeiros Joan M | $103,500 |
Source: Public Records
Tax History Compared to Growth
Tax History
| Year | Tax Paid | Tax Assessment Tax Assessment Total Assessment is a certain percentage of the fair market value that is determined by local assessors to be the total taxable value of land and additions on the property. | Land | Improvement |
|---|---|---|---|---|
| 2025 | $4,566 | $398,800 | $115,400 | $283,400 |
| 2024 | $4,220 | $367,300 | $113,200 | $254,100 |
| 2023 | $3,923 | $319,700 | $102,000 | $217,700 |
| 2022 | $3,657 | $289,800 | $96,200 | $193,600 |
| 2021 | $3,449 | $249,400 | $91,900 | $157,500 |
| 2020 | $3,111 | $215,300 | $87,700 | $127,600 |
| 2019 | $3,071 | $210,600 | $91,700 | $118,900 |
| 2018 | $2,902 | $198,500 | $92,300 | $106,200 |
| 2017 | $2,708 | $193,400 | $92,300 | $101,100 |
| 2016 | $2,646 | $194,100 | $95,200 | $98,900 |
| 2015 | $2,337 | $178,700 | $79,600 | $99,100 |
| 2014 | $2,395 | $190,400 | $83,700 | $106,700 |
Source: Public Records
Map
Nearby Homes
- 415 Anthony St
- 478 Tucker St
- 125 Carl St
- 539 Aetna St
- 59 Wayne St
- 1441 Stafford Rd
- 59 Denver St
- 256 Rhode Island Ave
- 495 Chicago St
- 1553 Rodman St
- 80 Lane St
- 228 Dickinson St
- 323 S Oxford St
- 191 Glasgow St Unit 2
- 191 Glasgow St Unit 1
- 239 Glasgow St Unit 8
- 217 Napoleon St
- 185 Stevens St
- 306 Mott St
- 352 Vale St Unit 1