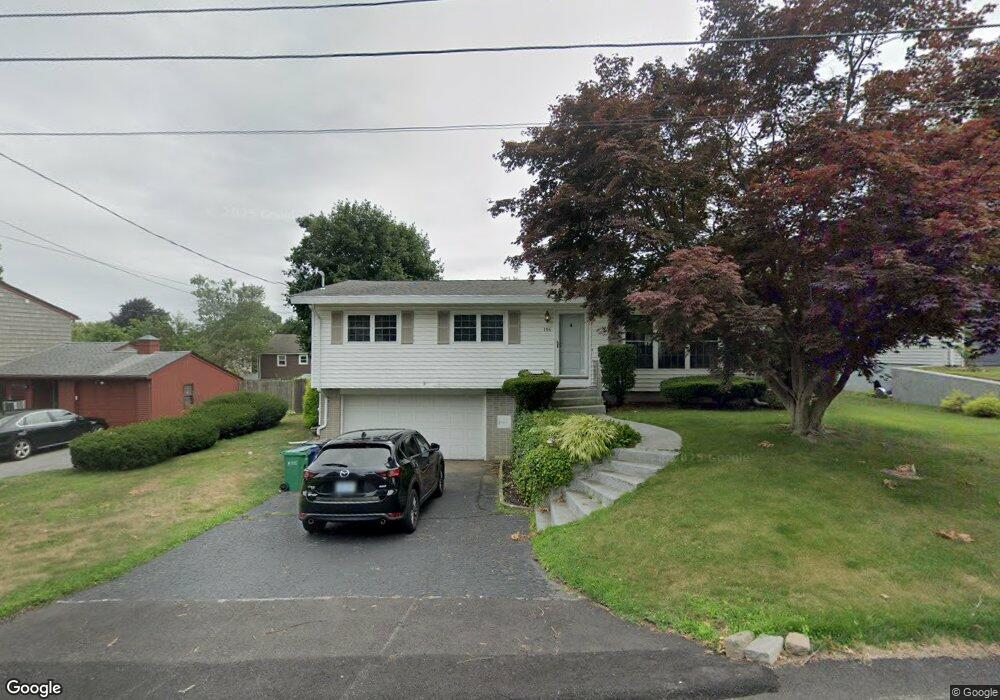
106 Landon Rd Warwick, RI 02888
Palace Garden NeighborhoodEstimated Value: $403,000 - $456,000
3
Beds
1
Bath
1,144
Sq Ft
$377/Sq Ft
Est. Value
About This Home
This home is located at 106 Landon Rd, Warwick, RI 02888 and is currently estimated at $431,373, approximately $377 per square foot. 106 Landon Rd is a home located in Kent County with nearby schools including St. Peter School and Saint Paul School.
Ownership History
Date
Name
Owned For
Owner Type
Purchase Details
Closed on
May 1, 2025
Sold by
Holmes Cynthia J
Bought by
Damico Angelina M
Current Estimated Value
Home Financials for this Owner
Home Financials are based on the most recent Mortgage that was taken out on this home.
Original Mortgage
$320,000
Outstanding Balance
$317,425
Interest Rate
6.67%
Mortgage Type
Purchase Money Mortgage
Estimated Equity
$113,948
Purchase Details
Closed on
Jun 28, 2002
Sold by
Falvey Joan E and Falvey Joan E
Bought by
Holmes Cynthia J
Purchase Details
Closed on
Jul 19, 1990
Sold by
Decotis Olive M
Bought by
Decotis Donald M
Create a Home Valuation Report for This Property
The Home Valuation Report is an in-depth analysis detailing your home's value as well as a comparison with similar homes in the area
Home Values in the Area
Average Home Value in this Area
Purchase History
| Date | Buyer | Sale Price | Title Company |
|---|---|---|---|
| Damico Angelina M | $400,000 | None Available | |
| Damico Angelina M | $400,000 | None Available | |
| Holmes Cynthia J | $165,000 | -- | |
| Decotis Donald M | $75,000 | -- | |
| Decotis Donald M | $75,000 | -- | |
| Holmes Cynthia J | $165,000 | -- |
Source: Public Records
Mortgage History
| Date | Status | Borrower | Loan Amount |
|---|---|---|---|
| Open | Damico Angelina M | $320,000 | |
| Closed | Damico Angelina M | $320,000 | |
| Previous Owner | Decotis Donald M | $88,000 | |
| Previous Owner | Decotis Donald M | $15,000 |
Source: Public Records
Tax History
| Year | Tax Paid | Tax Assessment Tax Assessment Total Assessment is a certain percentage of the fair market value that is determined by local assessors to be the total taxable value of land and additions on the property. | Land | Improvement |
|---|---|---|---|---|
| 2025 | $5,272 | $415,100 | $169,000 | $246,100 |
| 2024 | $5,148 | $355,800 | $147,000 | $208,800 |
| 2023 | $5,003 | $352,600 | $147,000 | $205,600 |
| 2022 | $4,806 | $256,600 | $102,700 | $153,900 |
| 2021 | $4,806 | $256,600 | $102,700 | $153,900 |
| 2020 | $4,806 | $256,600 | $102,700 | $153,900 |
| 2019 | $4,806 | $256,600 | $102,700 | $153,900 |
| 2018 | $4,181 | $201,000 | $95,300 | $105,700 |
| 2017 | $4,068 | $201,000 | $95,300 | $105,700 |
| 2016 | $4,068 | $201,000 | $95,300 | $105,700 |
| 2015 | $3,781 | $182,200 | $90,200 | $92,000 |
| 2014 | $3,655 | $182,200 | $90,200 | $92,000 |
| 2013 | $3,606 | $182,200 | $90,200 | $92,000 |
Source: Public Records
Map
Nearby Homes
- 45 Winthrop Rd
- 400 Narragansett Pkwy Unit NB1
- 400 Narragansett Pkwy Unit SC7
- 8 Gillooly Dr
- 287 Parkside Dr
- 34 N Country Club Dr
- 46 N Country Club Dr
- 10 Manse Ct
- 28 Rosegarden St
- 23 Lawn Ave
- 48 Barker St
- 56 Errol St
- 0 Remington St
- 48 Lane 2
- 161 Adams St
- 375 Namquid Dr
- 200 Post Rd Unit 610
- 281 Spring Green Rd
- 1047 Narragansett Pkwy
- 175 Monroe St
Your Personal Tour Guide
Ask me questions while you tour the home.