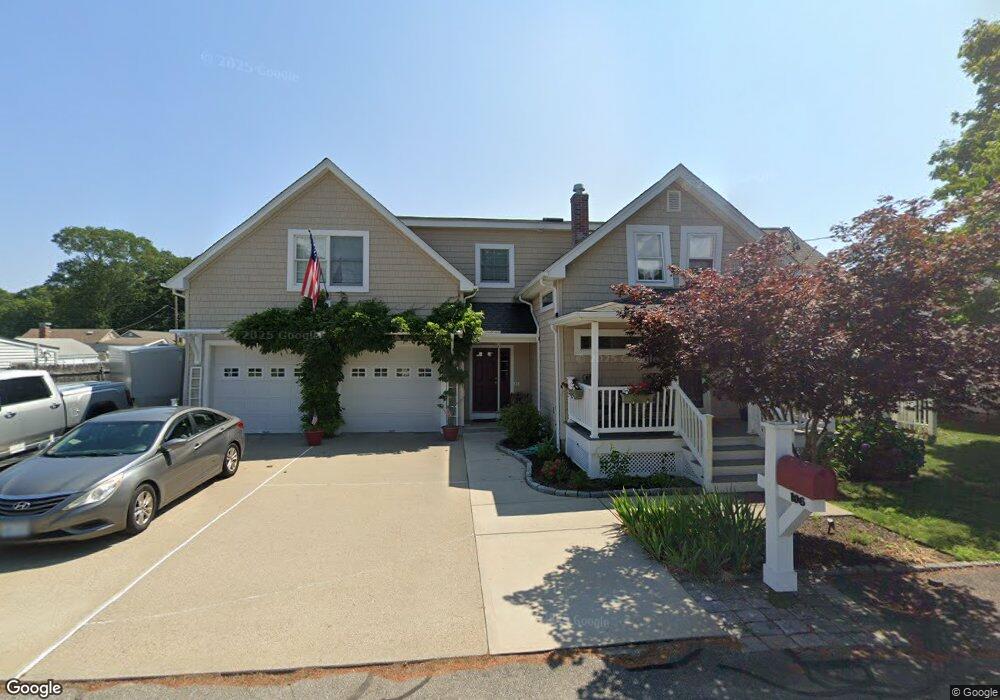
106 Lee Ave Warwick, RI 02889
Oakland Beach NeighborhoodEstimated Value: $336,000 - $507,000
4
Beds
1
Bath
1,000
Sq Ft
$427/Sq Ft
Est. Value
About This Home
This home is located at 106 Lee Ave, Warwick, RI 02889 and is currently estimated at $426,743, approximately $426 per square foot. 106 Lee Ave is a home located in Kent County with nearby schools including Saint Kevin School and Bishop Hendricken High School.
Ownership History
Date
Name
Owned For
Owner Type
Purchase Details
Closed on
May 15, 2013
Sold by
Hoagland Heather L and Hoagland Kenneth
Bought by
Bent Heather L and Bent Michael
Current Estimated Value
Purchase Details
Closed on
Sep 22, 2000
Sold by
Rodges Mechele R
Bought by
Hoagland Heather L
Home Financials for this Owner
Home Financials are based on the most recent Mortgage that was taken out on this home.
Original Mortgage
$91,104
Interest Rate
8%
Mortgage Type
Purchase Money Mortgage
Purchase Details
Closed on
Jun 2, 1994
Sold by
Wallentin Thomas M
Bought by
Rodgers Mechele R
Home Financials for this Owner
Home Financials are based on the most recent Mortgage that was taken out on this home.
Original Mortgage
$88,400
Interest Rate
8.49%
Mortgage Type
Purchase Money Mortgage
Purchase Details
Closed on
Oct 4, 1991
Sold by
Vieira Barbara A
Bought by
Wallentin Thomas M
Home Financials for this Owner
Home Financials are based on the most recent Mortgage that was taken out on this home.
Original Mortgage
$84,600
Interest Rate
9.08%
Mortgage Type
Purchase Money Mortgage
Create a Home Valuation Report for This Property
The Home Valuation Report is an in-depth analysis detailing your home's value as well as a comparison with similar homes in the area
Home Values in the Area
Average Home Value in this Area
Purchase History
| Date | Buyer | Sale Price | Title Company |
|---|---|---|---|
| Bent Heather L | -- | -- | |
| Hoagland Heather L | $92,000 | -- | |
| Rodgers Mechele R | $88,500 | -- | |
| Wallentin Thomas M | $90,000 | -- | |
| Wallentin Thomas M | $90,000 | -- |
Source: Public Records
Mortgage History
| Date | Status | Borrower | Loan Amount |
|---|---|---|---|
| Previous Owner | Wallentin Thomas M | $299,250 | |
| Previous Owner | Wallentin Thomas M | $91,104 | |
| Previous Owner | Wallentin Thomas M | $88,400 | |
| Previous Owner | Wallentin Thomas M | $84,600 |
Source: Public Records
Tax History Compared to Growth
Tax History
| Year | Tax Paid | Tax Assessment Tax Assessment Total Assessment is a certain percentage of the fair market value that is determined by local assessors to be the total taxable value of land and additions on the property. | Land | Improvement |
|---|---|---|---|---|
| 2025 | $6,575 | $517,700 | $92,400 | $425,300 |
| 2024 | $6,286 | $434,400 | $74,600 | $359,800 |
| 2023 | $6,164 | $434,400 | $74,600 | $359,800 |
| 2022 | $5,986 | $319,600 | $44,800 | $274,800 |
| 2021 | $5,986 | $319,600 | $44,800 | $274,800 |
| 2020 | $5,986 | $319,600 | $44,800 | $274,800 |
| 2019 | $5,986 | $319,600 | $44,800 | $274,800 |
| 2018 | $5,244 | $252,100 | $41,600 | $210,500 |
| 2017 | $5,103 | $252,100 | $41,600 | $210,500 |
| 2016 | $5,103 | $252,100 | $41,600 | $210,500 |
| 2015 | $5,472 | $263,700 | $46,400 | $217,300 |
| 2014 | $5,290 | $263,700 | $46,400 | $217,300 |
| 2013 | $5,219 | $263,700 | $46,400 | $217,300 |
Source: Public Records
Map
Nearby Homes
- 75 Northup St
- 71 Northup St
- 31 Oakhurst Ave
- 80 Northup St
- 209 Wood St
- 141 Brush Neck Ave
- 107 Coburn St
- 176 Canfield Ave
- 9 Chelmsford Ave
- 34 Pequot Ave
- 235 Pequot Ave
- 191 Canfield Ave
- 0 Sea View Dr
- 76 Kenway Ave
- 178 Manning St
- 117 Second Point Rd
- 19 Curtis St
- 206 Reynolds Ave
- 83 Ottawa Ave
- 52 Uncas St