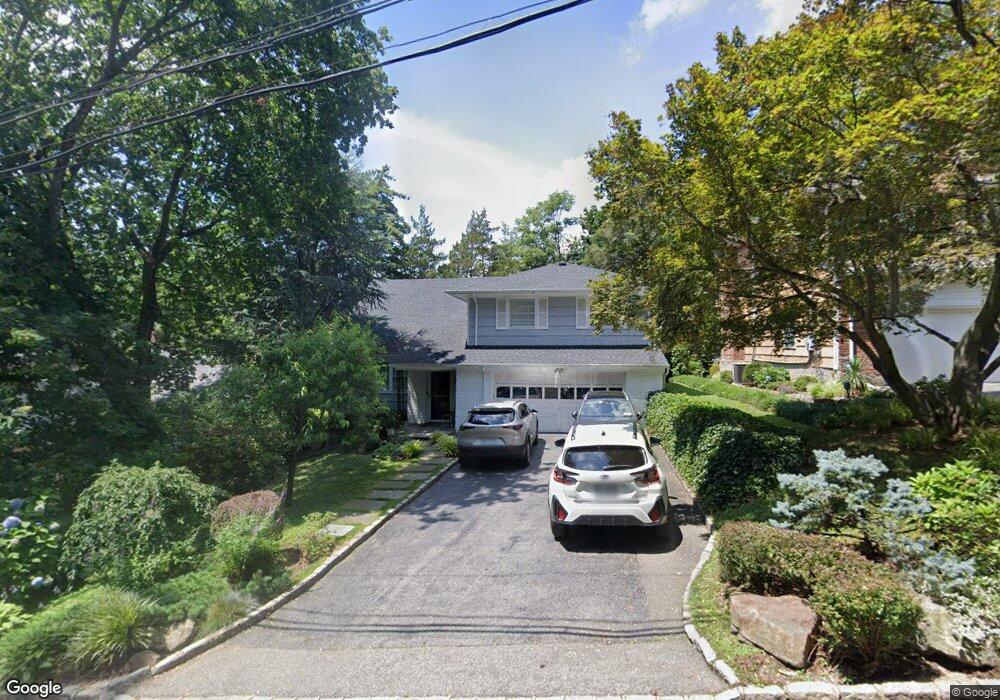
106 Luquer Rd Port Washington, NY 11050
Estimated Value: $1,466,501 - $1,667,000
--
Bed
3
Baths
2,236
Sq Ft
$701/Sq Ft
Est. Value
About This Home
This home is located at 106 Luquer Rd, Port Washington, NY 11050 and is currently estimated at $1,566,751, approximately $700 per square foot. 106 Luquer Rd is a home located in Nassau County with nearby schools including John Philip Sousa Elementary School, Carrie Palmer Weber Middle School, and Paul D. Schreiber Senior High School.
Ownership History
Date
Name
Owned For
Owner Type
Purchase Details
Closed on
Oct 1, 2009
Sold by
Shikhverg Valery and Shikhverg Ludmila
Bought by
Lanfant Mattieu W and Lanfant Katya S
Current Estimated Value
Home Financials for this Owner
Home Financials are based on the most recent Mortgage that was taken out on this home.
Original Mortgage
$688,000
Outstanding Balance
$449,483
Interest Rate
5.09%
Mortgage Type
Purchase Money Mortgage
Estimated Equity
$1,117,268
Create a Home Valuation Report for This Property
The Home Valuation Report is an in-depth analysis detailing your home's value as well as a comparison with similar homes in the area
Home Values in the Area
Average Home Value in this Area
Purchase History
| Date | Buyer | Sale Price | Title Company |
|---|---|---|---|
| Lanfant Mattieu W | $860,000 | -- |
Source: Public Records
Mortgage History
| Date | Status | Borrower | Loan Amount |
|---|---|---|---|
| Open | Lanfant Mattieu W | $688,000 |
Source: Public Records
Tax History Compared to Growth
Tax History
| Year | Tax Paid | Tax Assessment Tax Assessment Total Assessment is a certain percentage of the fair market value that is determined by local assessors to be the total taxable value of land and additions on the property. | Land | Improvement |
|---|---|---|---|---|
| 2025 | $22,016 | $933 | $390 | $543 |
| 2024 | $7,306 | $1,026 | $429 | $597 |
| 2023 | $21,449 | $1,035 | $432 | $603 |
| 2022 | $21,449 | $1,060 | $443 | $617 |
| 2021 | $21,482 | $1,103 | $415 | $688 |
| 2020 | $22,277 | $1,750 | $1,053 | $697 |
| 2019 | $24,622 | $2,040 | $1,228 | $812 |
| 2018 | $26,950 | $2,001 | $0 | $0 |
| 2017 | $15,322 | $2,001 | $1,228 | $773 |
| 2016 | $23,601 | $2,001 | $1,228 | $773 |
| 2015 | $8,066 | $2,001 | $1,228 | $773 |
| 2014 | $8,066 | $2,001 | $1,228 | $773 |
| 2013 | $7,591 | $2,001 | $1,228 | $773 |
Source: Public Records
Map
Nearby Homes