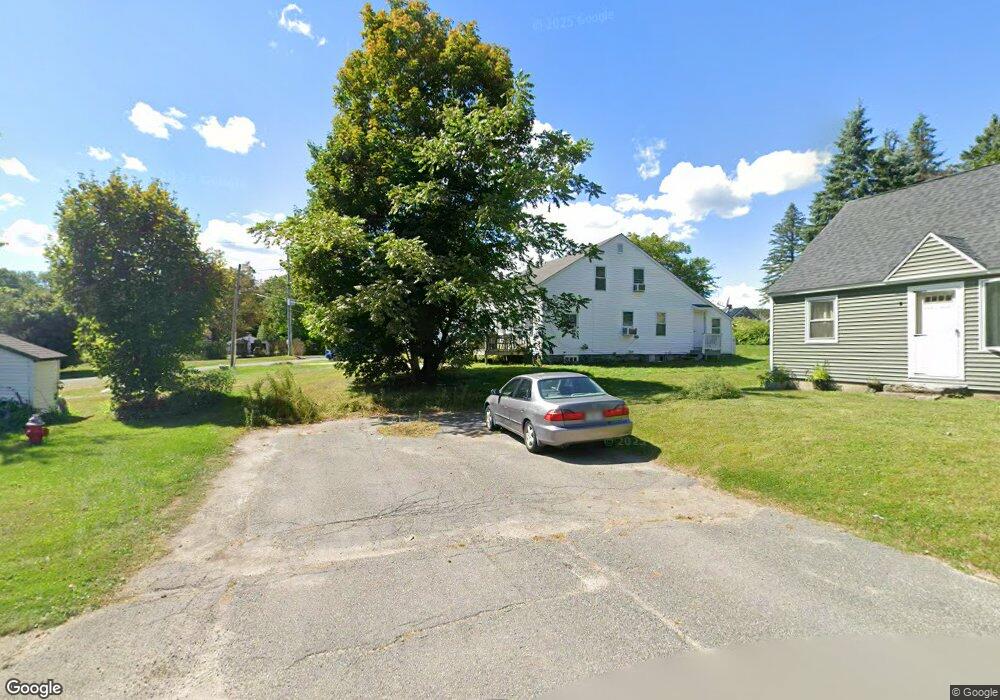
106 Main St Dalton, MA 01226
Estimated Value: $622,000 - $754,000
5
Beds
3
Baths
2,162
Sq Ft
$312/Sq Ft
Est. Value
About This Home
This home is located at 106 Main St, Dalton, MA 01226 and is currently estimated at $675,357, approximately $312 per square foot. 106 Main St is a home located in Berkshire County with nearby schools including Wahconah Regional High School, St. Agnes Academy, and Branches School of the Berkshires.
Ownership History
Date
Name
Owned For
Owner Type
Purchase Details
Closed on
Dec 23, 2023
Sold by
Black Dog Family Prop Llc
Bought by
Black Bear Holdings I Llc
Current Estimated Value
Purchase Details
Closed on
Dec 27, 2022
Sold by
Mccusker Matthew
Bought by
Black Dog Family Prop Llc
Purchase Details
Closed on
Feb 17, 2021
Sold by
Freedom Mortgage Corp
Bought by
Mccusker Matthew
Purchase Details
Closed on
Jan 12, 2021
Sold by
Pettijohn Rachel and Freedom Mortgage Corp
Bought by
Freedom Mortgage Corp
Purchase Details
Closed on
Oct 30, 2015
Sold by
Morse Kelly
Bought by
Stbernard D and Pettijohn Rachael L
Home Financials for this Owner
Home Financials are based on the most recent Mortgage that was taken out on this home.
Original Mortgage
$191,468
Interest Rate
3.92%
Mortgage Type
FHA
Purchase Details
Closed on
Nov 15, 2005
Sold by
Morse Leon and Morse Barbara L
Bought by
Morse Kelly
Home Financials for this Owner
Home Financials are based on the most recent Mortgage that was taken out on this home.
Original Mortgage
$176,000
Interest Rate
5.93%
Mortgage Type
Purchase Money Mortgage
Create a Home Valuation Report for This Property
The Home Valuation Report is an in-depth analysis detailing your home's value as well as a comparison with similar homes in the area
Home Values in the Area
Average Home Value in this Area
Purchase History
| Date | Buyer | Sale Price | Title Company |
|---|---|---|---|
| Black Bear Holdings I Llc | $615,000 | None Available | |
| Black Dog Family Prop Llc | -- | None Available | |
| Mccusker Matthew | $169,611 | None Available | |
| Freedom Mortgage Corp | $169,100 | None Available | |
| Stbernard D | $195,000 | -- | |
| Morse Kelly | $170,000 | -- |
Source: Public Records
Mortgage History
| Date | Status | Borrower | Loan Amount |
|---|---|---|---|
| Previous Owner | Stbernard D | $191,468 | |
| Previous Owner | Morse Kelly | $176,000 |
Source: Public Records
Tax History
| Year | Tax Paid | Tax Assessment Tax Assessment Total Assessment is a certain percentage of the fair market value that is determined by local assessors to be the total taxable value of land and additions on the property. | Land | Improvement |
|---|---|---|---|---|
| 2025 | $1,650 | $613,500 | $76,200 | $537,300 |
| 2024 | $1,003 | $359,600 | $73,200 | $286,400 |
| 2023 | $650 | $242,600 | $71,900 | $170,700 |
| 2022 | $703 | $234,300 | $71,900 | $162,400 |
| 2021 | $649 | $217,800 | $71,900 | $145,900 |
| 2020 | $606 | $217,900 | $71,900 | $146,000 |
| 2019 | $712 | $213,900 | $71,900 | $142,000 |
| 2018 | $928 | $207,100 | $71,900 | $135,200 |
| 2017 | $604 | $205,500 | $71,900 | $133,600 |
| 2016 | $493 | $205,600 | $71,900 | $133,700 |
| 2015 | $590 | $207,800 | $74,100 | $133,700 |
Source: Public Records
Map
Nearby Homes
- 0 Crane Ave
- 18 Chestnut St
- 149 Kittredge Rd
- 121 Kittredge Rd
- 18 Morningview Dr
- 53 Meadowview Dr
- 165 High St
- 127 Pinecrest Dr
- 77 Elaine Ave
- 68 Howe Rd
- 1 Pondview Dr Unit C3
- 750 Main St
- 60 North St Unit 7
- 20 Prospect St
- 395 Cheshire Rd Unit 114
- 395 Cheshire Rd Unit 103
- 395 Cheshire Rd Unit 101
- 395 Cheshire Rd Unit 102
- 395 Cheshire Rd Unit 112
- 395 Cheshire Rd Unit 113
Your Personal Tour Guide
Ask me questions while you tour the home.