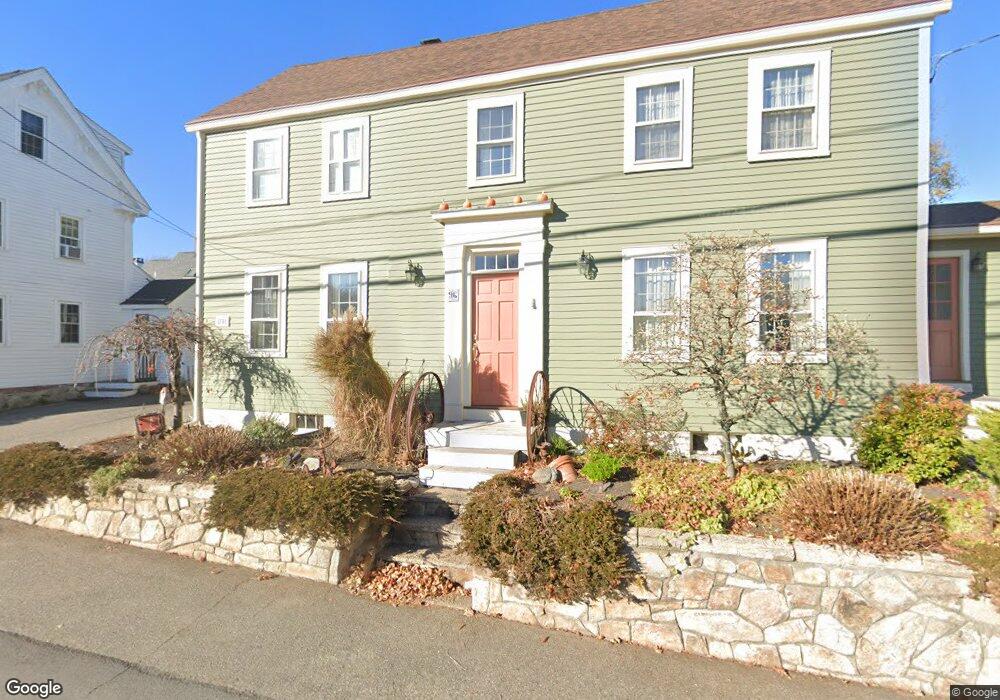
106 Main St New Castle, NH 03854
New Castle Island NeighborhoodEstimated Value: $1,158,000 - $1,617,000
3
Beds
3
Baths
1,387
Sq Ft
$1,046/Sq Ft
Est. Value
About This Home
This home is located at 106 Main St, New Castle, NH 03854 and is currently estimated at $1,450,418, approximately $1,045 per square foot. 106 Main St is a home with nearby schools including Maude H. Trefethen School.
Ownership History
Date
Name
Owned For
Owner Type
Purchase Details
Closed on
Feb 21, 2003
Sold by
Borden David
Bought by
Gardner Mark H and Gardner Patricia A
Current Estimated Value
Purchase Details
Closed on
Sep 12, 1997
Sold by
Mcintyre Hugh D and Mcintyre Nancy A
Bought by
Semprini Wayne P and Semprini Paulette D
Home Financials for this Owner
Home Financials are based on the most recent Mortgage that was taken out on this home.
Original Mortgage
$122,500
Interest Rate
7.31%
Create a Home Valuation Report for This Property
The Home Valuation Report is an in-depth analysis detailing your home's value as well as a comparison with similar homes in the area
Home Values in the Area
Average Home Value in this Area
Purchase History
| Date | Buyer | Sale Price | Title Company |
|---|---|---|---|
| Gardner Mark H | $15,000 | -- | |
| Semprini Wayne P | $175,000 | -- |
Source: Public Records
Mortgage History
| Date | Status | Borrower | Loan Amount |
|---|---|---|---|
| Open | Semprini Wayne P | $125,000 | |
| Previous Owner | Semprini Wayne P | $122,500 |
Source: Public Records
Tax History
| Year | Tax Paid | Tax Assessment Tax Assessment Total Assessment is a certain percentage of the fair market value that is determined by local assessors to be the total taxable value of land and additions on the property. | Land | Improvement |
|---|---|---|---|---|
| 2025 | $6,719 | $1,246,600 | $1,020,600 | $226,000 |
| 2024 | $6,719 | $1,246,600 | $1,020,600 | $226,000 |
| 2023 | $6,208 | $1,246,600 | $1,020,600 | $226,000 |
| 2022 | $5,610 | $1,246,600 | $1,020,600 | $226,000 |
| 2021 | $5,959 | $1,246,600 | $1,020,600 | $226,000 |
| 2020 | $9,903 | $735,700 | $543,000 | $192,700 |
| 2019 | $56 | $735,700 | $543,000 | $192,700 |
| 2018 | $4,599 | $735,700 | $543,000 | $192,700 |
| 2016 | $4,304 | $735,700 | $543,000 | $192,700 |
| 2015 | $3,907 | $610,400 | $460,600 | $149,800 |
| 2014 | $4,019 | $608,900 | $460,600 | $148,300 |
| 2013 | $3,889 | $608,600 | $460,600 | $148,000 |
Source: Public Records
Map
Nearby Homes
- 24 Seabreeze Ln
- 18 Mainmast Cir
- 8 Campbells Ln
- 75 Marina Heights Rd
- 24 Newson Ave
- 12 Gillis Dr Unit 3
- 4 Trefethen Ave
- 25 S Mill St
- 17 Commercial St
- 36 State St
- 144 Washington St
- 80 State St Unit 302
- 137 Walker Bungalow Rd
- 137 Daniel St Unit D302
- 159 State St Unit 1b
- 267 Pioneer Rd
- 35 Badgers Island W Unit 203
- 35 Badgers Island W Unit 301
- 35 Badgers Island W Unit 302
- 35 Badgers Island W Unit 103
Your Personal Tour Guide
Ask me questions while you tour the home.