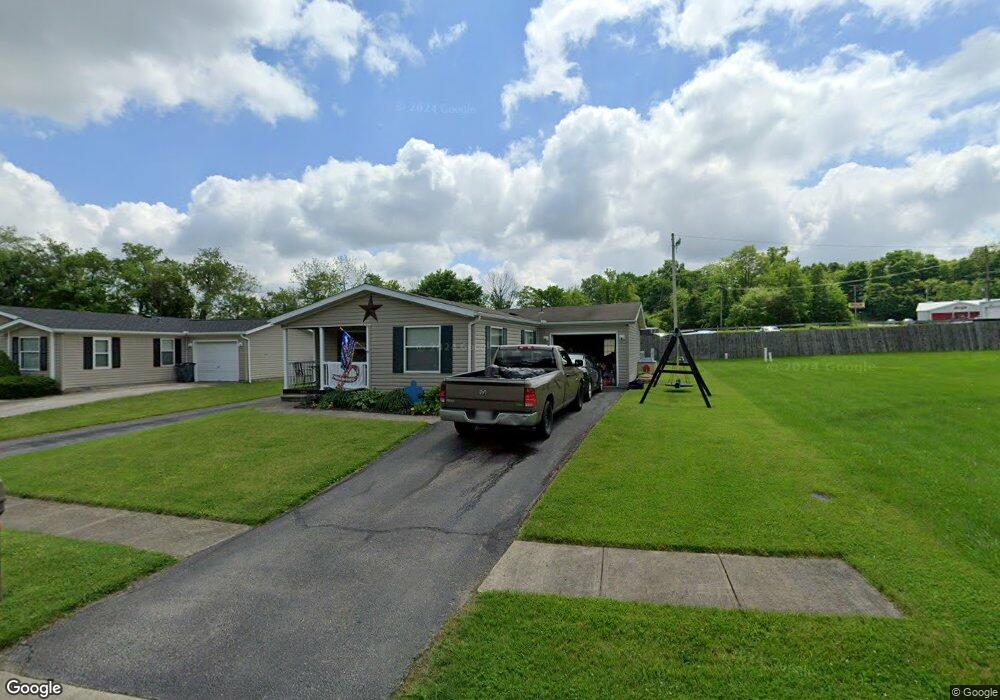
106 Maple Run Dr Hillsboro, OH 45133
Estimated Value: $137,000 - $167,000
3
Beds
2
Baths
1,164
Sq Ft
$132/Sq Ft
Est. Value
About This Home
This home is located at 106 Maple Run Dr, Hillsboro, OH 45133 and is currently estimated at $153,333, approximately $131 per square foot. 106 Maple Run Dr is a home located in Highland County with nearby schools including Hillsboro Primary School, Hillsboro Middle School, and Hillsboro High School.
Ownership History
Date
Name
Owned For
Owner Type
Purchase Details
Closed on
Apr 29, 2016
Sold by
Cordrey Jessica
Bought by
Cordrey Craig
Current Estimated Value
Purchase Details
Closed on
May 2, 2008
Sold by
Woodring Doug
Bought by
Cordrey Craig and Cordrey Jessica
Home Financials for this Owner
Home Financials are based on the most recent Mortgage that was taken out on this home.
Original Mortgage
$55,109
Outstanding Balance
$34,900
Interest Rate
5.88%
Mortgage Type
VA
Estimated Equity
$118,433
Purchase Details
Closed on
Feb 20, 2008
Sold by
Hud
Bought by
Woodring Doug
Purchase Details
Closed on
Nov 29, 2006
Sold by
Lawwill Jammey L
Bought by
Hud
Purchase Details
Closed on
Jul 2, 2004
Sold by
Holiday Homes Inc
Bought by
Lawwill Jammey L and Lawwill Marianna
Home Financials for this Owner
Home Financials are based on the most recent Mortgage that was taken out on this home.
Original Mortgage
$101,408
Interest Rate
6.4%
Mortgage Type
FHA
Create a Home Valuation Report for This Property
The Home Valuation Report is an in-depth analysis detailing your home's value as well as a comparison with similar homes in the area
Home Values in the Area
Average Home Value in this Area
Purchase History
| Date | Buyer | Sale Price | Title Company |
|---|---|---|---|
| Cordrey Craig | -- | Attorney | |
| Cordrey Craig | $54,500 | Technetitle Agency Inc | |
| Woodring Doug | $30,359 | None Available | |
| Hud | $44,000 | None Available | |
| Lawwill Jammey L | $103,000 | Springdale Title Agency Llc |
Source: Public Records
Mortgage History
| Date | Status | Borrower | Loan Amount |
|---|---|---|---|
| Open | Cordrey Craig | $55,109 | |
| Previous Owner | Lawwill Jammey L | $101,408 |
Source: Public Records
Tax History Compared to Growth
Tax History
| Year | Tax Paid | Tax Assessment Tax Assessment Total Assessment is a certain percentage of the fair market value that is determined by local assessors to be the total taxable value of land and additions on the property. | Land | Improvement |
|---|---|---|---|---|
| 2024 | $1,082 | $31,540 | $3,500 | $28,040 |
| 2023 | $1,082 | $24,500 | $3,010 | $21,490 |
| 2022 | $925 | $24,500 | $3,010 | $21,490 |
| 2021 | $884 | $24,500 | $3,010 | $21,490 |
| 2020 | $674 | $20,440 | $2,520 | $17,920 |
| 2019 | $655 | $20,440 | $2,520 | $17,920 |
| 2018 | $650 | $20,440 | $2,520 | $17,920 |
| 2017 | $719 | $22,510 | $2,280 | $20,230 |
| 2016 | $720 | $22,510 | $2,280 | $20,230 |
| 2015 | $376 | $22,510 | $2,280 | $20,230 |
| 2014 | $787 | $22,510 | $2,280 | $20,230 |
| 2013 | $788 | $22,510 | $2,280 | $20,230 |
Source: Public Records
Map
Nearby Homes
- 63 Willettsville Pike
- 129 Lanewood Dr
- 147 W Main St
- 7049 Pea Ridge Ct
- 0 Highway 50 Unit 1857481
- 129 Vaughn Ave
- 6805 Pea Ridge Rd
- 7615 Pea Ridge Rd Unit B
- 7615 Pea Ridge Rd Unit A
- 7615 Pea Ridge Rd
- 7619 Pea Ridge Rd Unit A
- 7619 Pea Ridge Rd
- 222 John St
- 337 N West St
- 508 N West St
- 115 Terrace Ave
- 640 N West St
- 144 Springlake Ave
- 131 W Collins Ave
- 119 S West St
- 110 Maple Run Dr
- 7 Maple Run Dr
- 15 Maple Run Dr
- 21 Maple Run Dr
- 102 Maple Run Dr
- 108 Maple Run Dr
- 116 Maple Dr
- 116 Maple Run Dr
- 112 Maple Run Dr
- 111 Maple Run Dr
- 107 Maple Run Dr
- 105 Maple Run Dr
- 100 Maple Run Dr
- 109 Maple Run Dr
- 103 Maple Run Dr
- 118 Maple Run Dr
- 113 Maple Run Dr
- 101 Maple Run Dr
- 120 Maple Run Dr
- 115 Maple Run Dr