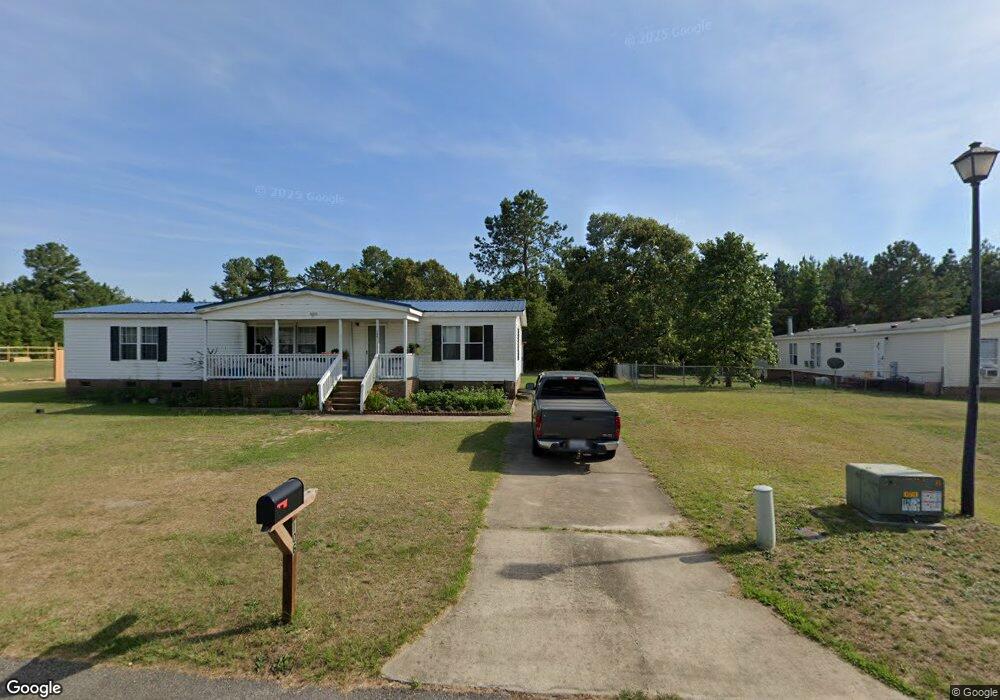
106 Mciver Ln Raeford, NC 28376
Estimated Value: $163,000 - $208,000
3
Beds
2
Baths
1,620
Sq Ft
$111/Sq Ft
Est. Value
About This Home
This home is located at 106 Mciver Ln, Raeford, NC 28376 and is currently estimated at $180,333, approximately $111 per square foot. 106 Mciver Ln is a home located in Hoke County with nearby schools including Sandy Grove Elementary School, Sandy Grove Middle School, and Hoke County High.
Ownership History
Date
Name
Owned For
Owner Type
Purchase Details
Closed on
Apr 20, 2017
Sold by
U S Bank N A
Bought by
Huertas Joes Barreto
Current Estimated Value
Purchase Details
Closed on
Apr 29, 2013
Sold by
Secretary Of Hud Of Washington Dc
Bought by
Us Bank Na
Purchase Details
Closed on
Aug 28, 2006
Sold by
Gillis Development Church Rd
Bought by
May James Kenneth and May Nadine White
Home Financials for this Owner
Home Financials are based on the most recent Mortgage that was taken out on this home.
Original Mortgage
$81,357
Interest Rate
6.67%
Mortgage Type
FHA
Create a Home Valuation Report for This Property
The Home Valuation Report is an in-depth analysis detailing your home's value as well as a comparison with similar homes in the area
Home Values in the Area
Average Home Value in this Area
Purchase History
| Date | Buyer | Sale Price | Title Company |
|---|---|---|---|
| Huertas Joes Barreto | $28,000 | None Available | |
| Us Bank Na | -- | None Available | |
| May James Kenneth | $82,000 | None Available |
Source: Public Records
Mortgage History
| Date | Status | Borrower | Loan Amount |
|---|---|---|---|
| Previous Owner | May James Kenneth | $81,357 |
Source: Public Records
Tax History Compared to Growth
Tax History
| Year | Tax Paid | Tax Assessment Tax Assessment Total Assessment is a certain percentage of the fair market value that is determined by local assessors to be the total taxable value of land and additions on the property. | Land | Improvement |
|---|---|---|---|---|
| 2024 | $970 | $102,470 | $22,500 | $79,970 |
| 2023 | $970 | $102,470 | $22,500 | $79,970 |
| 2022 | $953 | $102,470 | $22,500 | $79,970 |
| 2021 | $878 | $90,820 | $22,500 | $68,320 |
| 2020 | $891 | $90,820 | $22,500 | $68,320 |
| 2019 | $891 | $90,820 | $22,500 | $68,320 |
| 2018 | $891 | $90,820 | $22,500 | $68,320 |
| 2017 | $891 | $90,820 | $22,500 | $68,320 |
| 2016 | $876 | $90,820 | $22,500 | $68,320 |
| 2015 | $876 | $90,820 | $22,500 | $68,320 |
| 2014 | $855 | $90,820 | $22,500 | $68,320 |
| 2013 | -- | $87,120 | $21,000 | $66,120 |
Source: Public Records
Map
Nearby Homes