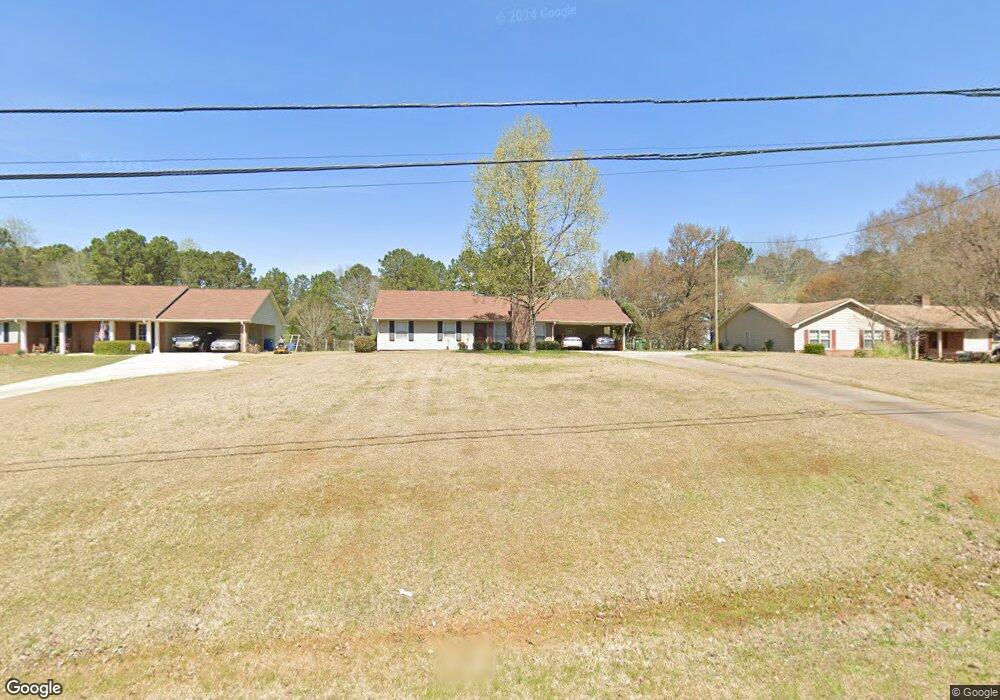
106 Meadowland Trail Lagrange, GA 30240
Estimated Value: $174,000 - $253,000
3
Beds
2
Baths
1,032
Sq Ft
$205/Sq Ft
Est. Value
About This Home
This home is located at 106 Meadowland Trail, Lagrange, GA 30240 and is currently estimated at $211,481, approximately $204 per square foot. 106 Meadowland Trail is a home located in Troup County with nearby schools including Franklin Forest Elementary School, Hillcrest Elementary School, and Hollis Hand Elementary School.
Ownership History
Date
Name
Owned For
Owner Type
Purchase Details
Closed on
Apr 4, 2003
Sold by
Jane A Schoore Mauldin
Bought by
Mauldin Jane A
Current Estimated Value
Purchase Details
Closed on
Dec 17, 2001
Sold by
Timmy E Mauldin
Bought by
Jane A Schoore Mauldin
Purchase Details
Closed on
Jul 29, 1993
Sold by
Timmy E Mauldin
Bought by
Timmy E Mauldin
Purchase Details
Closed on
Dec 31, 1991
Sold by
Federal Home Loan
Bought by
Timmy E Mauldin
Purchase Details
Closed on
Sep 11, 1991
Sold by
Timothy M Ellen
Bought by
Federal Home Loan
Purchase Details
Closed on
Jul 28, 1986
Sold by
Jessie Johmn N and Jessie Byrd
Bought by
Timothy M Ellen
Purchase Details
Closed on
Nov 1, 1982
Sold by
Chapelgate Properties
Bought by
Jessie Johmn N and Jessie Byrd
Purchase Details
Closed on
Sep 1, 1982
Sold by
Family Prop Inc
Bought by
Chapelgate Properties
Purchase Details
Closed on
Sep 30, 1980
Bought by
Family Prop Inc
Create a Home Valuation Report for This Property
The Home Valuation Report is an in-depth analysis detailing your home's value as well as a comparison with similar homes in the area
Purchase History
| Date | Buyer | Sale Price | Title Company |
|---|---|---|---|
| Mauldin Jane A | -- | -- | |
| Jane A Schoore Mauldin | -- | -- | |
| Timmy E Mauldin | -- | -- | |
| Timmy E Mauldin | $65,000 | -- | |
| Federal Home Loan | -- | -- | |
| Timothy M Ellen | $62,500 | -- | |
| Jessie Johmn N | $51,500 | -- | |
| Chapelgate Properties | -- | -- | |
| Family Prop Inc | -- | -- |
Source: Public Records
Tax History
| Year | Tax Paid | Tax Assessment Tax Assessment Total Assessment is a certain percentage of the fair market value that is determined by local assessors to be the total taxable value of land and additions on the property. | Land | Improvement |
|---|---|---|---|---|
| 2025 | $1,613 | $64,936 | $14,000 | $50,936 |
| 2024 | $1,423 | $54,176 | $14,000 | $40,176 |
| 2023 | $1,236 | $47,296 | $10,000 | $37,296 |
| 2022 | $1,194 | $44,776 | $10,000 | $34,776 |
| 2021 | $1,216 | $42,312 | $10,000 | $32,312 |
| 2020 | $1,216 | $42,312 | $10,000 | $32,312 |
| 2019 | $767 | $27,424 | $3,600 | $23,824 |
| 2018 | $701 | $25,236 | $3,600 | $21,636 |
| 2017 | $701 | $25,236 | $3,600 | $21,636 |
| 2016 | $705 | $25,362 | $3,600 | $21,762 |
| 2015 | $707 | $25,362 | $3,600 | $21,762 |
| 2014 | $673 | $24,216 | $3,600 | $20,616 |
| 2013 | -- | $24,760 | $3,600 | $21,160 |
Source: Public Records
Map
Nearby Homes
- 115 Meadowland Trail
- 104 Englewood Dr
- 91 Richmond Dr
- 114 Red Oak Trail
- 104 Sweetgum Dr
- 209 River Oaks Dr
- 103 Windridge
- 1784 Mooty Bridge Rd
- 107 Windridge
- 204 Dixie Creek Dr
- 109 Windridge
- 102 Beech Creek Dr
- 502 Ashford Cir
- 103 Woodchase
- 200 Crestwood Dr
- 134 S Page St
- 519 Tradition Place
- 517 Tradition Place
- 201 S Chilton Crescent
- 129 Celebration Blvd
- 108 Meadowland Trail
- 104 Meadowland Trail
- 110 Meadowland Trail
- 102 Meadowland Trail
- 113 Richmond Dr
- 113 Richmond Dr Unit 17
- 109 Meadowland Trail
- 107 Meadowland Trail
- 114 Meadowland Trail
- 105 Meadowland Trail
- 100 Meadowland Trail
- 1403 New Franklin Rd
- 103 Meadowland Trail
- 112 Richmond Dr
- 112 Richmond Dr Unit 16
- 111 Meadowland Trail
- 101 Meadowland Trail
- 113 Meadowland Trail
- 116 Meadowland Trail
- 1409 New Franklin Rd
Your Personal Tour Guide
Ask me questions while you tour the home.