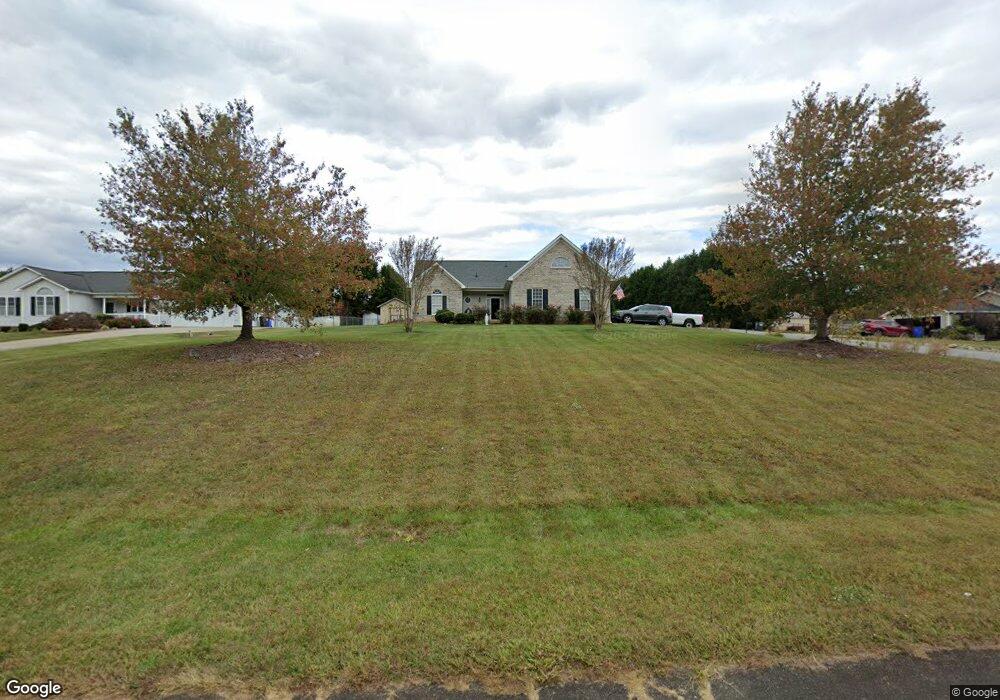
106 Morrison Creek Rd Statesville, NC 28625
Estimated Value: $313,000 - $335,000
3
Beds
2
Baths
1,570
Sq Ft
$207/Sq Ft
Est. Value
About This Home
This home is located at 106 Morrison Creek Rd, Statesville, NC 28625 and is currently estimated at $325,683, approximately $207 per square foot. 106 Morrison Creek Rd is a home located in Iredell County with nearby schools including N.B. Mills Elementary School, West Iredell Middle School, and West Iredell High School.
Ownership History
Date
Name
Owned For
Owner Type
Purchase Details
Closed on
May 15, 2018
Sold by
Gallyon Tracey Brown and Gallyon Ii Charles
Bought by
Mottl Dan J and Mottl Kathleen
Current Estimated Value
Purchase Details
Closed on
Apr 29, 2005
Sold by
Maltby & Ward Properties Llc
Bought by
Cauble Tracey B
Home Financials for this Owner
Home Financials are based on the most recent Mortgage that was taken out on this home.
Original Mortgage
$65,000
Interest Rate
5.88%
Mortgage Type
Fannie Mae Freddie Mac
Purchase Details
Closed on
Mar 3, 2003
Sold by
George Sondra and George John H
Bought by
Maltby & Ward Properties Llc
Home Financials for this Owner
Home Financials are based on the most recent Mortgage that was taken out on this home.
Original Mortgage
$14,850
Interest Rate
5.68%
Mortgage Type
Purchase Money Mortgage
Purchase Details
Closed on
Dec 1, 1997
Create a Home Valuation Report for This Property
The Home Valuation Report is an in-depth analysis detailing your home's value as well as a comparison with similar homes in the area
Home Values in the Area
Average Home Value in this Area
Purchase History
| Date | Buyer | Sale Price | Title Company |
|---|---|---|---|
| Mottl Dan J | $157,000 | None Available | |
| Cauble Tracey B | $152,400 | -- | |
| Maltby & Ward Properties Llc | $16,500 | -- | |
| -- | -- | -- |
Source: Public Records
Mortgage History
| Date | Status | Borrower | Loan Amount |
|---|---|---|---|
| Previous Owner | Cauble Tracey B | $65,000 | |
| Previous Owner | Cauble Tracey B | $50,000 | |
| Previous Owner | Maltby & Ward Properties Llc | $14,850 |
Source: Public Records
Tax History Compared to Growth
Tax History
| Year | Tax Paid | Tax Assessment Tax Assessment Total Assessment is a certain percentage of the fair market value that is determined by local assessors to be the total taxable value of land and additions on the property. | Land | Improvement |
|---|---|---|---|---|
| 2024 | $2,102 | $326,060 | $43,500 | $282,560 |
| 2023 | $1,984 | $326,060 | $43,500 | $282,560 |
| 2022 | $1,165 | $176,670 | $17,500 | $159,170 |
| 2021 | $1,165 | $176,670 | $17,500 | $159,170 |
| 2020 | $1,056 | $159,410 | $17,500 | $141,910 |
| 2019 | $1,021 | $156,250 | $17,500 | $138,750 |
| 2018 | $866 | $136,150 | $17,500 | $118,650 |
| 2017 | $866 | $136,150 | $17,500 | $118,650 |
| 2016 | $866 | $136,150 | $17,500 | $118,650 |
| 2015 | $866 | $136,150 | $17,500 | $118,650 |
| 2014 | $838 | $141,650 | $17,500 | $124,150 |
Source: Public Records
Map
Nearby Homes
- 146 Beech Brook Ln
- 212 Doe Trail Ln
- 124 Caribou Dr
- 482 Miller Farm Rd
- 120 Rosy Apple Ln Unit 124
- 165 Meadowlark Ln Unit 26
- 159 Bowman Rd
- 599 Scotts Creek Rd
- 113 E Edinburgh Ct
- 64 Heavenly Dr Unit 64
- 269 Monticello Rd
- 165 Fieldstone Farm Dr
- 648 Scotts Creek Rd
- 0 Butterfield Cir Unit 7
- 119 Red Cedar Ln
- 103 Red Cedar Ln
- 137 Red Cedar Ln
- 114 Cedar Ridge Loop
- 108 Red Cedar Ln
- 0 Cedarbrook Dr Unit 45
- 110 Morrison Creek Rd
- 105 Morrison Creek Rd
- 103 W Morrison Creek Rd
- 149 Red Buck Ln
- 109 Morrison Creek Rd
- 111 Morrison Creek Rd
- 112 Morrison Creek Rd
- 120 Morrison Creek Rd
- 119 Morrison Creek Rd
- 118 W Morrison Creek Rd
- 106 Ridgeview Rd
- 121 W Morrison Creek Rd
- 105 Ridgegate Ln
- 110 Ridgeview Rd
- 126 Morrison Creek Rd
- 116 Ridgeview Rd
- 116 Ridgeview Rd Unit 131
- 125 Morrison Creek Rd
- 124 Morrison Creek Rd
- 113 Ridgegate Ln