Estimated Value: $274,000 - $328,000
4
Beds
2
Baths
1,658
Sq Ft
$177/Sq Ft
Est. Value
About This Home
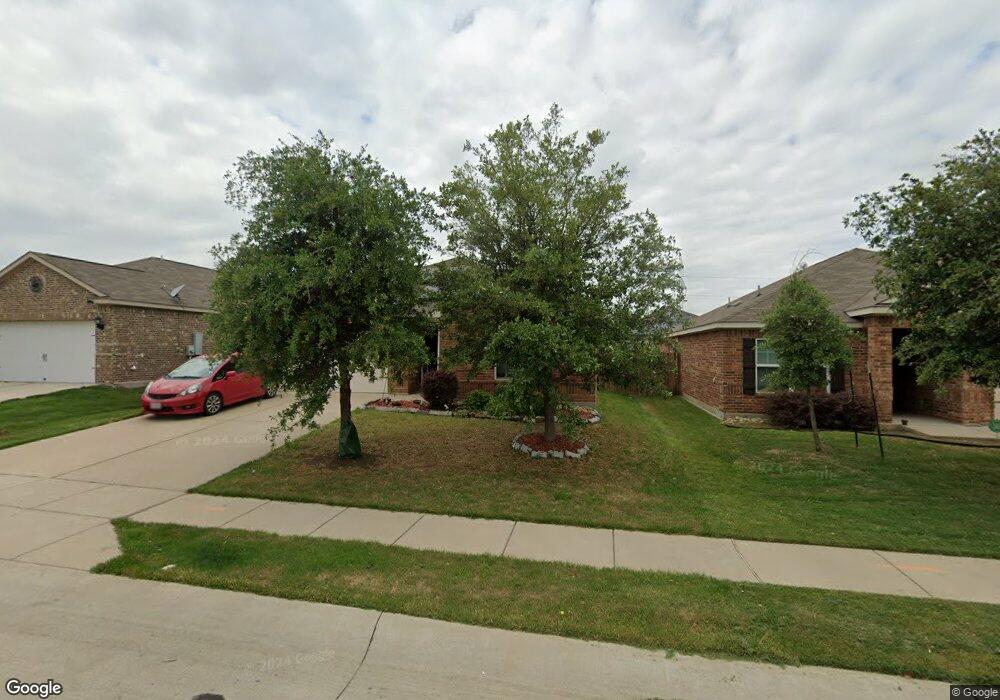
This home is located at 106 Mount Vernon Ln, Venus, TX 76084 and is currently estimated at $294,138, approximately $177 per square foot. 106 Mount Vernon Ln is a home located in Johnson County with nearby schools including Venus Primary School, Venus Elementary School, and Venus Middle School.
Ownership History
Date
Name
Owned For
Owner Type
Purchase Details
Closed on
Jul 15, 2025
Sold by
Lmc Real Estate Llc
Bought by
Lindeman Timothy W and Lindeman Gwen L
Current Estimated Value
Home Financials for this Owner
Home Financials are based on the most recent Mortgage that was taken out on this home.
Original Mortgage
$213,750
Outstanding Balance
$213,388
Interest Rate
6.85%
Mortgage Type
New Conventional
Estimated Equity
$80,750
Purchase Details
Closed on
Mar 27, 2025
Sold by
Fancher Amy Lea and Wiljanen Melinda Mae
Bought by
Lmc Real Estate Llc
Purchase Details
Closed on
Mar 3, 2017
Sold by
Lgi Homes Texas Llc
Bought by
Fancher Amy Lea and Wiljanen Melinda Mae
Home Financials for this Owner
Home Financials are based on the most recent Mortgage that was taken out on this home.
Original Mortgage
$191,369
Interest Rate
4.37%
Mortgage Type
FHA
Create a Home Valuation Report for This Property
The Home Valuation Report is an in-depth analysis detailing your home's value as well as a comparison with similar homes in the area
Home Values in the Area
Average Home Value in this Area
Purchase History
| Date | Buyer | Sale Price | Title Company |
|---|---|---|---|
| Lindeman Timothy W | -- | Capital Title | |
| Lmc Real Estate Llc | -- | Capital Title | |
| Fancher Amy Lea | -- | Texas American Title Co |
Source: Public Records
Mortgage History
| Date | Status | Borrower | Loan Amount |
|---|---|---|---|
| Open | Lindeman Timothy W | $213,750 | |
| Previous Owner | Fancher Amy Lea | $191,369 |
Source: Public Records
Tax History Compared to Growth
Tax History
| Year | Tax Paid | Tax Assessment Tax Assessment Total Assessment is a certain percentage of the fair market value that is determined by local assessors to be the total taxable value of land and additions on the property. | Land | Improvement |
|---|---|---|---|---|
| 2025 | $4,933 | $303,931 | $63,000 | $240,931 |
| 2024 | $6,167 | $257,759 | $0 | $0 |
| 2023 | $4,440 | $328,023 | $63,000 | $265,023 |
| 2022 | $5,615 | $261,752 | $50,000 | $211,752 |
| 2021 | $5,264 | $193,658 | $42,000 | $151,658 |
| 2020 | $5,384 | $185,876 | $20,000 | $165,876 |
| 2019 | $5,380 | $176,397 | $20,000 | $156,397 |
| 2018 | $5,379 | $176,397 | $20,000 | $156,397 |
| 2017 | $5,271 | $173,553 | $20,000 | $153,553 |
| 2016 | $4,862 | $160,080 | $15,000 | $145,080 |
Source: Public Records
Map
Nearby Homes
- 111 Rebel Rd
- 109 Independence Ave
- 133 Adams Ave
- 7133 Prairieside Trail
- 146 Independence Ave
- 127 Independence Ave
- 107 Kennedy Dr
- 161 Kennedy Dr
- 118 Washington Way
- 180 Kennedy Dr
- 114 Kennedy Dr
- 137 Jefferson Dr
- 149 Jefferson Dr
- 147 Washington Way
- 106 Rushmore Ln
- 117 Hamilton Way
- 191 Presidents Way
- 159 Bush Dr
- 122 Presidents Way
- 124 Crockett Way
- 106 Mount Vernon Ln
- 106 Mount Vernon Ln
- 108 Mount Vernon Ln
- 104 Mt Vernon Ln
- 104 Mount Vernon Ln
- 104 Mount Vernon Ln
- 107 Rebel Rd
- 102 Mt Vernon Ln
- 102 Mount Vernon Ln
- 102 Mount Vernon Ln
- 110 Mt Vernon Ln
- 110 Mount Vernon Ln
- 110 Mount Vernon Ln
- 110 Mount Vernon Ln
- 109 Rebel Rd
- 105 Rebel Rd
- 103 Rebel Rd
- 103 Rebel Rd
- 107 Mount Vernon Ln
- 107 Mount Vernon Ln