Estimated Value: $109,510 - $139,000
3
Beds
1
Bath
1,000
Sq Ft
$125/Sq Ft
Est. Value
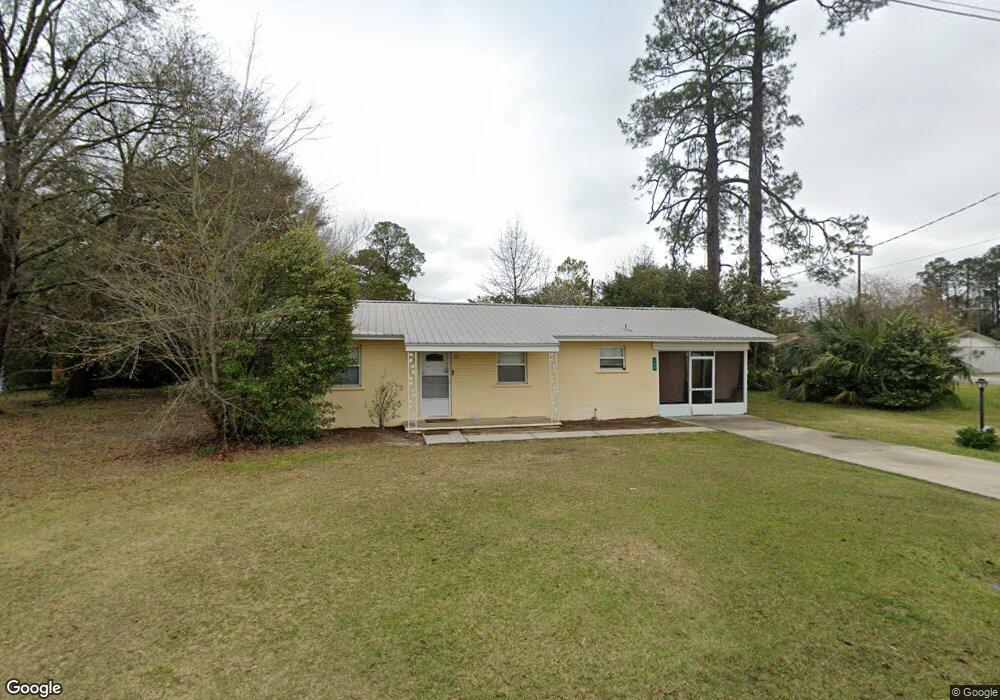
About This Home
This home is located at 106 N Cedar St, Adel, GA 31620 and is currently estimated at $125,170, approximately $125 per square foot. 106 N Cedar St is a home located in Cook County with nearby schools including Cook Primary School, Cook Elementary School, and Cook County Middle School.
Ownership History
Date
Name
Owned For
Owner Type
Purchase Details
Closed on
May 16, 2023
Sold by
Howze Clifford Keith
Bought by
Turn Key Rentals Llc
Current Estimated Value
Home Financials for this Owner
Home Financials are based on the most recent Mortgage that was taken out on this home.
Original Mortgage
$71,200
Outstanding Balance
$55,899
Interest Rate
6.39%
Mortgage Type
New Conventional
Estimated Equity
$69,271
Purchase Details
Closed on
May 8, 2023
Sold by
Howze Laqueta S
Bought by
Howze Clifford Keith
Home Financials for this Owner
Home Financials are based on the most recent Mortgage that was taken out on this home.
Original Mortgage
$71,200
Outstanding Balance
$55,899
Interest Rate
6.39%
Mortgage Type
New Conventional
Estimated Equity
$69,271
Purchase Details
Closed on
Sep 1, 2021
Sold by
Howze Keith
Bought by
Howze Laqueta S
Purchase Details
Closed on
Aug 18, 2017
Sold by
Howze Laqueta S
Bought by
Howze Keith and Howze Diane
Create a Home Valuation Report for This Property
The Home Valuation Report is an in-depth analysis detailing your home's value as well as a comparison with similar homes in the area
Home Values in the Area
Average Home Value in this Area
Purchase History
We collect this data history from publicly available records. To have your information removed, we recommend requesting removal directly through your county’s website.
| Date | Buyer | Sale Price | Title Company |
|---|---|---|---|
| Turn Key Rentals Llc | $85,000 | -- | |
| Howze Clifford Keith | -- | -- | |
| Howze Laqueta S | -- | -- | |
| Howze Keith | -- | -- |
Source: Public Records
Mortgage History
We collect this data history from publicly available records. To have your information removed, we recommend requesting removal directly through your county’s website.
| Date | Status | Borrower | Loan Amount |
|---|---|---|---|
| Open | Turn Key Rentals Llc | $71,200 |
Source: Public Records
Tax History
| Year | Tax Paid | Tax Assessment Tax Assessment Total Assessment is a certain percentage of the fair market value that is determined by local assessors to be the total taxable value of land and additions on the property. | Land | Improvement |
|---|---|---|---|---|
| 2025 | $1,199 | $38,854 | $2,774 | $36,080 |
| 2024 | $1,002 | $30,412 | $2,412 | $28,000 |
| 2023 | $490 | $14,866 | $2,154 | $12,712 |
| 2022 | $490 | $14,866 | $2,154 | $12,712 |
| 2021 | $435 | $12,346 | $2,154 | $10,192 |
| 2020 | $435 | $12,346 | $2,154 | $10,192 |
| 2019 | $436 | $12,346 | $2,154 | $10,192 |
| 2018 | $436 | $12,346 | $2,154 | $10,192 |
| 2017 | $218 | $12,346 | $2,154 | $10,192 |
| 2016 | $437 | $12,346 | $2,154 | $10,192 |
| 2015 | $218 | $12,346 | $2,154 | $10,192 |
| 2014 | $218 | $12,346 | $2,154 | $10,192 |
| 2013 | -- | $12,345 | $2,153 | $10,192 |
Source: Public Records
Map
Nearby Homes
- 729 W Seventh St
- 801 Glendale St
- 605 W 7th St
- 703 N Elm St
- 507 S Poplar St
- 11 Antioch Rd
- 411 S Hutchinson Ave
- 403 E 2nd St
- 814 N Cleveland Ave
- 309 Wayne St
- 700 S Gordon Ave
- 313 S Forrest Ave
- 609 E 4th St
- 123 Westover Dr
- 203 Magnolia Dr
- 806 S Forrest Ave
- 220 High St
- 708 Town And Country Dr
- 509 E Mitchell St
- 315 Newton Dr
Your Personal Tour Guide
Ask me questions while you tour the home.