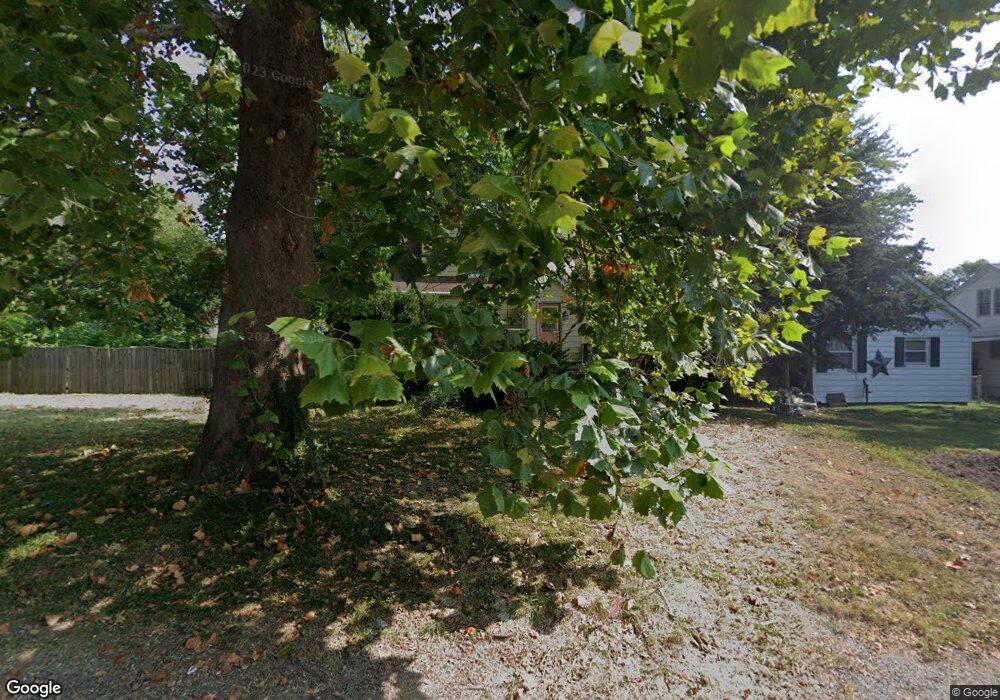
106 N Delaware Ave Belleville, IL 62221
Estimated Value: $120,000 - $237,000
4
Beds
2
Baths
1,850
Sq Ft
$94/Sq Ft
Est. Value
About This Home
This home is located at 106 N Delaware Ave, Belleville, IL 62221 and is currently estimated at $174,637, approximately $94 per square foot. 106 N Delaware Ave is a home located in St. Clair County with nearby schools including Jefferson Elementary School, West Jr High School, and Zion Lutheran School Belleville.
Ownership History
Date
Name
Owned For
Owner Type
Purchase Details
Closed on
Dec 12, 2025
Sold by
Ross William
Bought by
Ross William and Kondas Ross
Current Estimated Value
Purchase Details
Closed on
Jan 23, 2024
Sold by
Private Sales Corp
Bought by
Ross William Davis
Purchase Details
Closed on
Jul 16, 2007
Sold by
Vanhorn Sean P and Van Horn Donna M
Bought by
Vanhorn Sean P
Home Financials for this Owner
Home Financials are based on the most recent Mortgage that was taken out on this home.
Original Mortgage
$120,000
Interest Rate
6.76%
Mortgage Type
Stand Alone Refi Refinance Of Original Loan
Purchase Details
Closed on
Nov 26, 2003
Sold by
Masker Robin L and Masker David
Bought by
Vanhorn Sean P and Vanhorn Donna M
Home Financials for this Owner
Home Financials are based on the most recent Mortgage that was taken out on this home.
Original Mortgage
$87,188
Interest Rate
6.07%
Mortgage Type
FHA
Create a Home Valuation Report for This Property
The Home Valuation Report is an in-depth analysis detailing your home's value as well as a comparison with similar homes in the area
Home Values in the Area
Average Home Value in this Area
Purchase History
| Date | Buyer | Sale Price | Title Company |
|---|---|---|---|
| Ross William | -- | None Available | |
| Ross William Davis | $12,000 | None Available | |
| Vanhorn Sean P | -- | Nations Title Agency Of Miss | |
| Vanhorn Sean P | $88,000 | Town & Country Title Co |
Source: Public Records
Mortgage History
| Date | Status | Borrower | Loan Amount |
|---|---|---|---|
| Previous Owner | Vanhorn Sean P | $120,000 | |
| Previous Owner | Vanhorn Sean P | $87,188 |
Source: Public Records
Tax History
| Year | Tax Paid | Tax Assessment Tax Assessment Total Assessment is a certain percentage of the fair market value that is determined by local assessors to be the total taxable value of land and additions on the property. | Land | Improvement |
|---|---|---|---|---|
| 2024 | $3,988 | $45,351 | $9,228 | $36,123 |
| 2023 | $3,665 | $39,045 | $9,045 | $30,000 |
| 2022 | $3,364 | $35,151 | $8,143 | $27,008 |
| 2021 | $2,143 | $32,496 | $7,528 | $24,968 |
| 2020 | $2,036 | $30,730 | $7,119 | $23,611 |
| 2019 | $2,103 | $31,304 | $7,130 | $24,174 |
| 2018 | $2,032 | $30,627 | $6,976 | $23,651 |
| 2017 | $2,019 | $30,412 | $6,927 | $23,485 |
| 2016 | $1,983 | $29,766 | $6,780 | $22,986 |
| 2014 | $2,116 | $33,883 | $7,037 | $26,846 |
| 2013 | $2,268 | $34,368 | $7,138 | $27,230 |
Source: Public Records
Map
Nearby Homes
- 112 Colony Dr
- 130 N Indiana Ave
- 1801 E C St
- 1918 E C St
- 111 Kansas Ave
- 139 Kansas Ave
- 2407 E Main St
- 1804 Muren Blvd
- 2417 E Main St Unit REAR
- 1825 Muren Blvd
- 1715 Muren Blvd
- 38 N Michigan Ave
- 2105 E B St
- 1915 Muren Blvd
- 1801 E Belle Ave
- 13 Beth Ann Dr
- 134 N Florida Ave
- 1227 E B St Unit 1227/1229
- 113 Orchard Dr
- 2125 E B St
- 104 N Delaware Ave
- 110 N Delaware Ave Unit 112
- 114 N Delaware Ave
- 109 Colony Dr
- 102 N Delaware Ave
- 105 Colony Dr
- 113 Colony Dr
- 116 N Delaware Ave
- 123 N Delaware Ave
- 109 N Delaware Ave
- 1803 E A St
- 107 N Delaware Ave
- 118 N Delaware Ave
- 125 N Delaware Ave
- 125 N Delaware Ave
- 103 N Delaware Ave
- 1807 E A St
- 28 N Delaware Ave
- 114 Colony Dr
- 112 N Indiana Ave
Your Personal Tour Guide
Ask me questions while you tour the home.