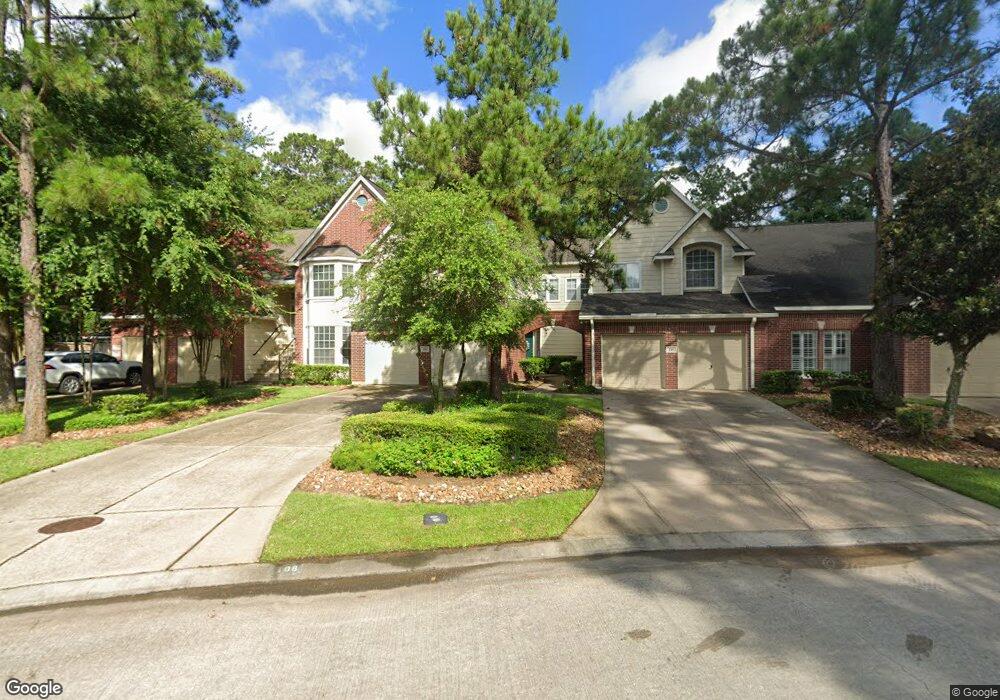
106 N Magnolia Pond Place Spring, TX 77381
Panther Creek NeighborhoodEstimated Value: $326,000 - $360,000
--
Bed
3
Baths
1,920
Sq Ft
$179/Sq Ft
Est. Value
About This Home
This home is located at 106 N Magnolia Pond Place, Spring, TX 77381 and is currently estimated at $343,521, approximately $178 per square foot. 106 N Magnolia Pond Place is a home located in Montgomery County with nearby schools including Ride Elementary School, Collins Intermediate School, and Knox J High School.
Ownership History
Date
Name
Owned For
Owner Type
Purchase Details
Closed on
Aug 30, 2006
Sold by
Rodgers Mac E
Bought by
Rodgers Julie Maunoir
Current Estimated Value
Purchase Details
Closed on
Oct 1, 2001
Sold by
Brown Karen Marie
Bought by
Rodgers Mac E and Rodgers Julie Maunoir
Home Financials for this Owner
Home Financials are based on the most recent Mortgage that was taken out on this home.
Original Mortgage
$126,350
Interest Rate
6.88%
Purchase Details
Closed on
Jun 30, 1995
Sold by
The Ryland Group Inc
Bought by
Brown Karen Marie
Home Financials for this Owner
Home Financials are based on the most recent Mortgage that was taken out on this home.
Original Mortgage
$80,000
Interest Rate
6.37%
Create a Home Valuation Report for This Property
The Home Valuation Report is an in-depth analysis detailing your home's value as well as a comparison with similar homes in the area
Home Values in the Area
Average Home Value in this Area
Purchase History
| Date | Buyer | Sale Price | Title Company |
|---|---|---|---|
| Rodgers Julie Maunoir | -- | South Land Title Of Montgome | |
| Rodgers Mac E | -- | -- | |
| Brown Karen Marie | -- | -- |
Source: Public Records
Mortgage History
| Date | Status | Borrower | Loan Amount |
|---|---|---|---|
| Previous Owner | Rodgers Mac E | $126,350 | |
| Previous Owner | Brown Karen Marie | $80,000 | |
| Closed | Rodgers Julie Maunoir | $0 |
Source: Public Records
Tax History Compared to Growth
Tax History
| Year | Tax Paid | Tax Assessment Tax Assessment Total Assessment is a certain percentage of the fair market value that is determined by local assessors to be the total taxable value of land and additions on the property. | Land | Improvement |
|---|---|---|---|---|
| 2025 | $1,488 | $312,775 | $13,452 | $299,323 |
| 2024 | $1,488 | $285,307 | -- | -- |
| 2023 | $1,442 | $259,370 | $13,450 | $303,000 |
| 2022 | $4,484 | $235,790 | $13,450 | $232,770 |
| 2021 | $4,395 | $214,350 | $13,450 | $200,900 |
| 2020 | $4,655 | $217,180 | $13,450 | $203,730 |
| 2019 | $5,095 | $229,830 | $13,450 | $216,380 |
| 2018 | $3,821 | $222,400 | $13,450 | $216,380 |
| 2017 | $4,571 | $202,180 | $13,450 | $188,730 |
| 2016 | $4,233 | $194,980 | $13,450 | $181,530 |
| 2015 | $3,788 | $189,170 | $13,450 | $207,660 |
| 2014 | $3,788 | $171,970 | $13,450 | $158,520 |
Source: Public Records
Map
Nearby Homes
- 94 S Magnolia Pond Place
- 135 N Magnolia Pond Place
- 138 N Magnolia Pond Place
- 150 N Magnolia Pond Place
- 19 Tremont Woods Ct
- 38 Cricket Hollow Place
- 15 Brentwood Oaks Ct
- 6 Fairmeade Bend Dr
- 7 Dusky Meadow Place
- 6 Sylvan Forest Dr
- 50 Lakeridge Dr
- 15 Lakeridge Dr
- 115 Fallshire Dr
- 19 Hickory Oak Dr
- 31 Treescape Cir
- 24 Woodelves Place
- 122 E Mistybreeze Cir
- 35 Woodelves Place
- 4 Hickory Oak Dr
- 52 Indian Clover Dr
- 110 N Magnolia Pond Place
- 102 N Magnolia Pond Place
- 102 N Magnolia Pond Place Unit 102B
- 102 N Magnolia Pond Place
- 98 N Magnolia Pond Place
- 118 N Magnolia Pond Place
- 118 N Magnolia Pond Place Unit 118D
- 90 S Magnolia Pond Place
- 90 S Magnolia Pond Place Unit 90
- 115 N Magnolia Pond Place
- 86 S Magnolia Pond Place
- 122 N Magnolia Pond Place
- 119 N Magnolia Pond Place
- 82 S Magnolia Pond Place
- 82 S Magnolia Pond Place Unit 82E
- 78 S Magnolia Pond Place
- 123 N Magnolia Pond Place
- 126 N Magnolia Pond Place
- 127 N Magnolia Pond Place
- 74 S Magnolia Pond Place