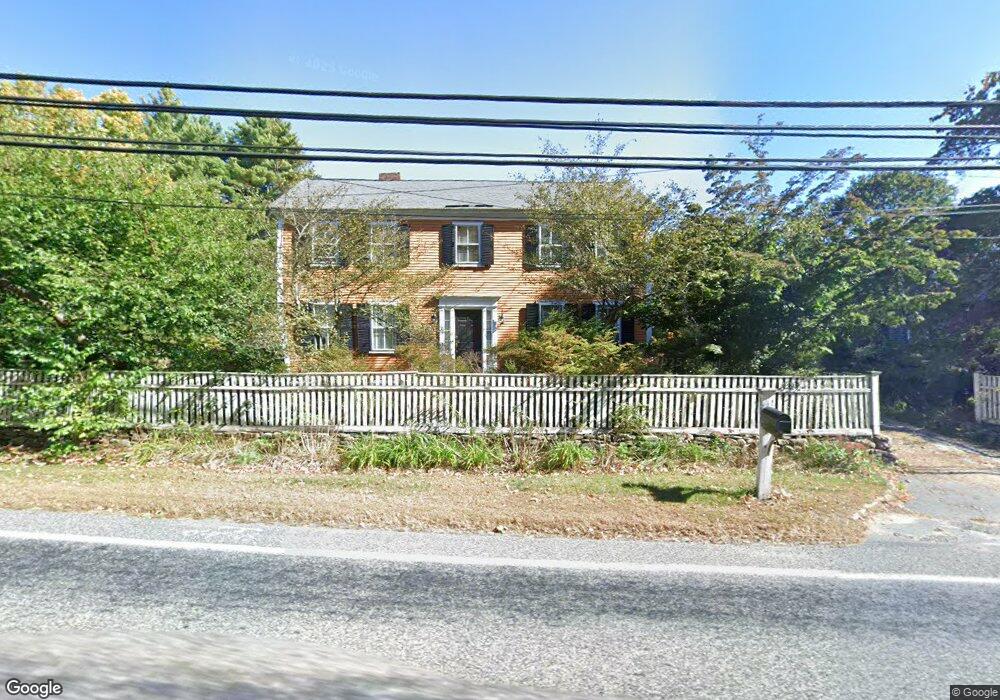
106 N Main St Sherborn, MA 01770
Estimated Value: $929,000 - $1,291,000
4
Beds
3
Baths
2,503
Sq Ft
$465/Sq Ft
Est. Value
About This Home
This home is located at 106 N Main St, Sherborn, MA 01770 and is currently estimated at $1,164,795, approximately $465 per square foot. 106 N Main St is a home located in Middlesex County with nearby schools including Pine Hill Elementary School, Dover-Sherborn Regional Middle School, and Dover-Sherborn Regional High School.
Ownership History
Date
Name
Owned For
Owner Type
Purchase Details
Closed on
Apr 1, 2004
Sold by
Ciampa Cheryl Bricker and Ciampa Keith G
Bought by
Tyler Charles W and Hablanian Jeanne M
Current Estimated Value
Home Financials for this Owner
Home Financials are based on the most recent Mortgage that was taken out on this home.
Original Mortgage
$350,000
Outstanding Balance
$163,556
Interest Rate
5.56%
Mortgage Type
Purchase Money Mortgage
Estimated Equity
$1,001,239
Purchase Details
Closed on
Nov 15, 1996
Sold by
Bishop Stephen H and Bishop Charlene M
Bought by
Ciampa Keith G and Ciampa Cheryl B
Create a Home Valuation Report for This Property
The Home Valuation Report is an in-depth analysis detailing your home's value as well as a comparison with similar homes in the area
Home Values in the Area
Average Home Value in this Area
Purchase History
| Date | Buyer | Sale Price | Title Company |
|---|---|---|---|
| Tyler Charles W | $888,000 | -- | |
| Ciampa Keith G | $392,000 | -- |
Source: Public Records
Mortgage History
| Date | Status | Borrower | Loan Amount |
|---|---|---|---|
| Open | Tyler Charles W | $350,000 | |
| Previous Owner | Ciampa Keith G | $323,000 | |
| Previous Owner | Ciampa Keith G | $325,000 | |
| Previous Owner | Ciampa Keith G | $15,000 |
Source: Public Records
Tax History Compared to Growth
Tax History
| Year | Tax Paid | Tax Assessment Tax Assessment Total Assessment is a certain percentage of the fair market value that is determined by local assessors to be the total taxable value of land and additions on the property. | Land | Improvement |
|---|---|---|---|---|
| 2025 | $17,641 | $1,064,000 | $383,100 | $680,900 |
| 2024 | $17,016 | $1,003,900 | $325,600 | $678,300 |
| 2023 | $16,123 | $895,200 | $325,600 | $569,600 |
| 2022 | $15,169 | $797,100 | $323,600 | $473,500 |
| 2021 | $16,838 | $797,100 | $323,600 | $473,500 |
| 2020 | $15,046 | $773,200 | $323,600 | $449,600 |
| 2019 | $14,699 | $749,200 | $323,600 | $425,600 |
| 2018 | $7,245 | $749,200 | $323,600 | $425,600 |
| 2017 | $13,995 | $684,000 | $308,500 | $375,500 |
| 2016 | $14,070 | $684,000 | $308,500 | $375,500 |
| 2015 | $13,803 | $679,300 | $300,500 | $378,800 |
| 2014 | $13,634 | $670,300 | $283,500 | $386,800 |
Source: Public Records
Map
Nearby Homes