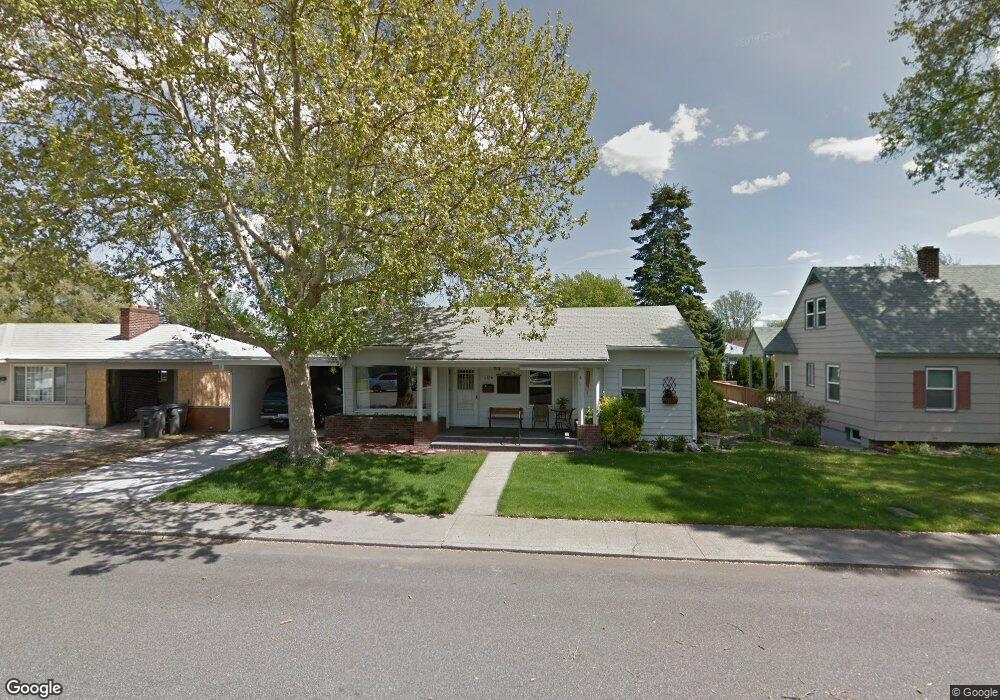
106 N Palouse St Kennewick, WA 99336
Estimated Value: $313,841 - $344,000
3
Beds
2
Baths
984
Sq Ft
$341/Sq Ft
Est. Value
About This Home
This home is located at 106 N Palouse St, Kennewick, WA 99336 and is currently estimated at $335,710, approximately $341 per square foot. 106 N Palouse St is a home located in Benton County with nearby schools including Amistad Elementary School, Park Middle School, and Kennewick High School.
Ownership History
Date
Name
Owned For
Owner Type
Purchase Details
Closed on
Oct 20, 2014
Sold by
Evans Deanna Cheryl
Bought by
Evans Deanna Cheryl
Current Estimated Value
Purchase Details
Closed on
May 1, 2014
Sold by
Evans Deanna Cheryl
Bought by
Evans Deanna Cheryl
Purchase Details
Closed on
Apr 22, 2014
Sold by
Harms Tiffany and Evans Corey
Bought by
Evans Deanna Cheryl
Purchase Details
Closed on
Jul 31, 2012
Sold by
Evans Jerry Dale
Bought by
Evans Jerry Dale and Evans Deanna Cheryl
Purchase Details
Closed on
Jul 18, 2011
Sold by
Evans Jerry Dale
Bought by
Evans Jerry Dale
Purchase Details
Closed on
Jul 28, 2006
Sold by
Evans Harold Dale and Evans Marie
Bought by
Evans Marie
Purchase Details
Closed on
Oct 31, 2005
Sold by
Washor Trust
Bought by
Evans H Dale and Evans Marie
Create a Home Valuation Report for This Property
The Home Valuation Report is an in-depth analysis detailing your home's value as well as a comparison with similar homes in the area
Home Values in the Area
Average Home Value in this Area
Purchase History
| Date | Buyer | Sale Price | Title Company |
|---|---|---|---|
| Evans Deanna Cheryl | -- | None Available | |
| Evans Deanna Cheryl | -- | None Available | |
| Evans Deanna Cheryl | -- | None Available | |
| Evans Jerry Dale | -- | None Available | |
| Evans Jerry Dale | -- | None Available | |
| Evans Marie | -- | None Available | |
| Evans H Dale | -- | None Available |
Source: Public Records
Tax History Compared to Growth
Tax History
| Year | Tax Paid | Tax Assessment Tax Assessment Total Assessment is a certain percentage of the fair market value that is determined by local assessors to be the total taxable value of land and additions on the property. | Land | Improvement |
|---|---|---|---|---|
| 2024 | $2,230 | $293,340 | $70,000 | $223,340 |
| 2023 | $2,230 | $277,390 | $70,000 | $207,390 |
| 2022 | $1,943 | $229,530 | $70,000 | $159,530 |
| 2021 | $1,851 | $197,580 | $40,000 | $157,580 |
| 2020 | $1,819 | $182,580 | $25,000 | $157,580 |
| 2019 | $1,557 | $171,710 | $25,000 | $146,710 |
| 2018 | $1,517 | $149,980 | $25,000 | $124,980 |
| 2017 | $1,385 | $119,500 | $25,000 | $94,500 |
| 2016 | $2,015 | $119,500 | $25,000 | $94,500 |
| 2015 | $2,018 | $137,690 | $25,000 | $112,690 |
| 2014 | -- | $137,690 | $25,000 | $112,690 |
| 2013 | -- | $137,690 | $25,000 | $112,690 |
Source: Public Records
Map
Nearby Homes
- 114 N Olympia St
- 6 N Olympia St
- 3051 Southgate Way
- 29 N Mayfield St
- 1220 W Kennewick Ave
- 1231 W 1st Ave
- 1206 W 2nd Ave
- 217 S Quincy St
- 214 S Quincy St
- 218 S Quincy St
- 102 S Rainier St
- 22 S Sharron St
- 1503 W 4th Place
- 420 S Quincy St
- 840 W Kennewick Ave
- 119 N Waverly Place Unit D
- 200 N Underwood St
- 2003 W Canal Dr
- 99 N Waverly Place Unit E
- 2029 W 4th Ave
- 102 N Palouse St
- 110 N Palouse St
- 105 N Olympia St
- 111 N Olympia St
- 101 N Olympia St
- 18 N Palouse St
- 114 N Palouse St
- 105 N Palouse St
- 17 N Olympia St Unit North side of Kennew
- 17 N Olympia St Unit Cozy Vintage Home W/
- 17 N Olympia St
- 113 N Olympia St
- 101 N Palouse St
- 109 N Palouse St
- 14 N Palouse St
- 17 N Palouse St
- 13 N Olympia St
- 202 N Palouse St
- 15 N Palouse St
- 10 N Palouse St