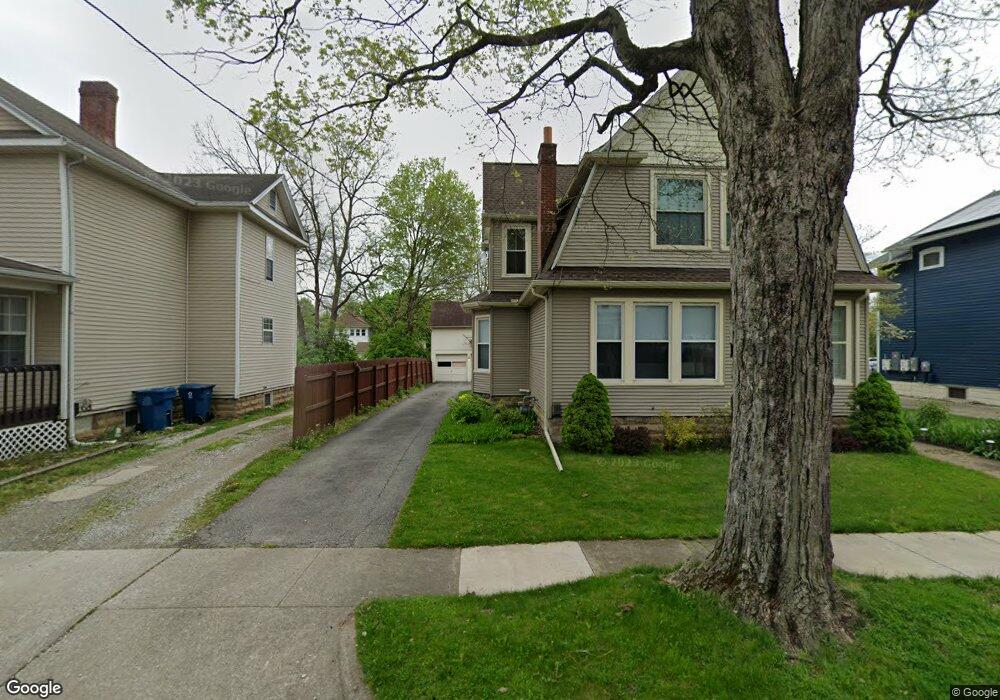
106 N Park St Mount Vernon, OH 43050
Estimated Value: $266,000 - $292,000
3
Beds
4
Baths
1,926
Sq Ft
$144/Sq Ft
Est. Value
About This Home
This home is located at 106 N Park St, Mount Vernon, OH 43050 and is currently estimated at $277,998, approximately $144 per square foot. 106 N Park St is a home located in Knox County with nearby schools including Mount Vernon High School, St. Vincent de Paul School, and Christian Star Academy.
Ownership History
Date
Name
Owned For
Owner Type
Purchase Details
Closed on
Mar 25, 2011
Sold by
Webber Christopher J and Webber Heidi M
Bought by
Rouhier Matthew F and Rouhier Kerry A
Current Estimated Value
Home Financials for this Owner
Home Financials are based on the most recent Mortgage that was taken out on this home.
Original Mortgage
$120,368
Interest Rate
4.75%
Mortgage Type
FHA
Purchase Details
Closed on
Apr 6, 2005
Sold by
Williams Jeffrey C and Williams Jill K
Bought by
Webber Christopher J and Webber Heidi M
Home Financials for this Owner
Home Financials are based on the most recent Mortgage that was taken out on this home.
Original Mortgage
$84,800
Interest Rate
5.71%
Mortgage Type
New Conventional
Purchase Details
Closed on
Apr 14, 2003
Sold by
Williams Jeffrey C
Bought by
Williams Jeffrey C and Williams Jill
Purchase Details
Closed on
Mar 10, 2003
Sold by
Williams Donna A
Bought by
Williams Jeffrey C
Create a Home Valuation Report for This Property
The Home Valuation Report is an in-depth analysis detailing your home's value as well as a comparison with similar homes in the area
Home Values in the Area
Average Home Value in this Area
Purchase History
| Date | Buyer | Sale Price | Title Company |
|---|---|---|---|
| Rouhier Matthew F | $92,625 | None Available | |
| Webber Christopher J | $88,875 | None Available | |
| Williams Jeffrey C | -- | -- | |
| Williams Jeffrey C | -- | -- |
Source: Public Records
Mortgage History
| Date | Status | Borrower | Loan Amount |
|---|---|---|---|
| Closed | Farley William | $166,050 | |
| Closed | Rouhier Matthew F | $120,368 | |
| Previous Owner | Webber Christopher J | $84,800 |
Source: Public Records
Tax History Compared to Growth
Tax History
| Year | Tax Paid | Tax Assessment Tax Assessment Total Assessment is a certain percentage of the fair market value that is determined by local assessors to be the total taxable value of land and additions on the property. | Land | Improvement |
|---|---|---|---|---|
| 2024 | $2,284 | $59,150 | $9,600 | $49,550 |
| 2023 | $2,284 | $59,150 | $9,600 | $49,550 |
| 2022 | $1,961 | $46,210 | $7,500 | $38,710 |
| 2021 | $1,961 | $46,210 | $7,500 | $38,710 |
| 2020 | $1,910 | $46,210 | $7,500 | $38,710 |
| 2019 | $1,863 | $42,020 | $9,490 | $32,530 |
| 2018 | $1,863 | $42,020 | $9,490 | $32,530 |
| 2017 | $1,830 | $42,020 | $9,490 | $32,530 |
| 2016 | $1,697 | $38,900 | $8,780 | $30,120 |
| 2015 | $1,705 | $38,900 | $8,780 | $30,120 |
| 2014 | $1,713 | $38,900 | $8,780 | $30,120 |
| 2013 | $1,646 | $35,560 | $8,250 | $27,310 |
Source: Public Records
Map
Nearby Homes
- 205 E Chestnut St
- 205 N Clinton St
- 505 E Chestnut St
- 504 E Chestnut St
- 202 E Pleasant St
- 503 E Gambier St Unit C
- 116 E Pleasant St
- 119 E Gambier St
- 304 N Gay St
- 405 E Ohio Ave
- 404 N Gay St
- 0 S Main St
- 604 N Gay St
- 7 Elizabeth St
- 800 E Vine St
- 105 N Center St
- 806 N Gay St
- 13 Mansfield Ave
- 0 W Pleasant St
- 104 N Park St
- 110 N Park St
- 220 E Sugar St
- 105 N Park St
- 217 E Chestnut St
- 105 N Division St
- 11 Coshocton Ave
- 200 N Park St
- 107 N Division St
- 0 Coshocton Ave Unit 3970036
- 0 Coshocton Ave Unit 755361
- 0 Coshocton Ave Unit 213016151
- 0 Coshocton Ave Unit 20210828
- 0 Coshocton Ave Unit 221043611
- 0 Coshocton Ave Unit 20210720
- 0 Coshocton Ave Unit 20210718
- 0 Coshocton Ave Unit 217021384
- 0 Coshocton Ave Unit 215019352
- 0 Coshocton Ave Unit 20130639
- 0 Coshocton Ave Unit 20130994