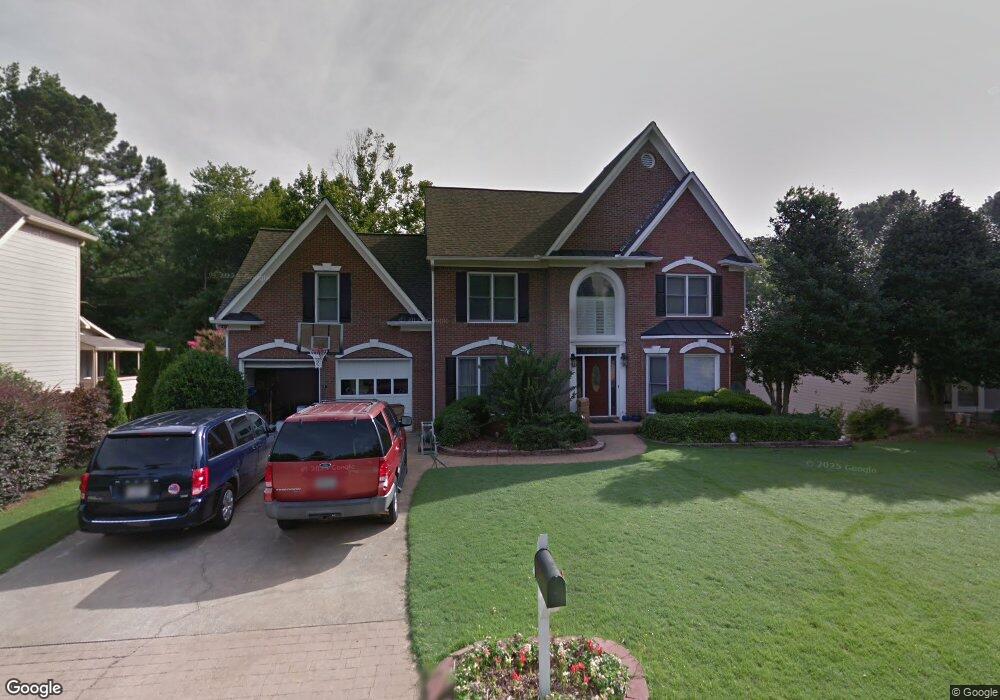
106 Oak Pointe Ct NW Unit 3 Acworth, GA 30102
Oak Grove NeighborhoodEstimated Value: $493,000 - $551,955
4
Beds
4
Baths
3,954
Sq Ft
$132/Sq Ft
Est. Value
About This Home
This home is located at 106 Oak Pointe Ct NW Unit 3, Acworth, GA 30102 and is currently estimated at $522,478, approximately $132 per square foot. 106 Oak Pointe Ct NW Unit 3 is a home located in Cherokee County with nearby schools including E. T. Booth Middle School, Etowah High School, and Cornerstone Preparatory Academy.
Ownership History
Date
Name
Owned For
Owner Type
Purchase Details
Closed on
Jul 29, 2004
Sold by
Bravo Leonard J and Bravo Maria
Bought by
Hooker John W and Hooker Jennifer
Current Estimated Value
Home Financials for this Owner
Home Financials are based on the most recent Mortgage that was taken out on this home.
Original Mortgage
$192,000
Outstanding Balance
$95,239
Interest Rate
6.22%
Mortgage Type
New Conventional
Estimated Equity
$427,239
Purchase Details
Closed on
May 25, 1999
Sold by
Campbell James C and Campbell Valerie N
Bought by
Bravo Leonard J and Bravo Maria
Home Financials for this Owner
Home Financials are based on the most recent Mortgage that was taken out on this home.
Original Mortgage
$183,600
Interest Rate
7.27%
Mortgage Type
New Conventional
Purchase Details
Closed on
Dec 28, 1995
Sold by
Brothers Pritchard
Bought by
Campbell James C Valerie N
Create a Home Valuation Report for This Property
The Home Valuation Report is an in-depth analysis detailing your home's value as well as a comparison with similar homes in the area
Home Values in the Area
Average Home Value in this Area
Purchase History
| Date | Buyer | Sale Price | Title Company |
|---|---|---|---|
| Hooker John W | $240,000 | -- | |
| Bravo Leonard J | $229,500 | -- | |
| Campbell James C Valerie N | $206,300 | -- |
Source: Public Records
Mortgage History
| Date | Status | Borrower | Loan Amount |
|---|---|---|---|
| Open | Hooker John W | $192,000 | |
| Previous Owner | Bravo Leonard J | $183,600 | |
| Closed | Campbell James C Valerie N | $0 |
Source: Public Records
Tax History Compared to Growth
Tax History
| Year | Tax Paid | Tax Assessment Tax Assessment Total Assessment is a certain percentage of the fair market value that is determined by local assessors to be the total taxable value of land and additions on the property. | Land | Improvement |
|---|---|---|---|---|
| 2025 | $4,572 | $192,440 | $42,000 | $150,440 |
| 2024 | $4,634 | $197,048 | $42,000 | $155,048 |
| 2023 | $4,042 | $189,616 | $42,000 | $147,616 |
| 2022 | $3,980 | $163,784 | $28,600 | $135,184 |
| 2021 | $3,759 | $140,072 | $28,600 | $111,472 |
| 2020 | $3,552 | $131,000 | $28,600 | $102,400 |
| 2019 | $3,333 | $121,560 | $24,440 | $97,120 |
| 2018 | $3,315 | $120,040 | $24,440 | $95,600 |
| 2017 | $3,226 | $287,800 | $24,440 | $90,680 |
| 2016 | $2,931 | $257,500 | $24,440 | $78,560 |
| 2015 | $2,823 | $245,800 | $24,440 | $73,880 |
| 2014 | $2,575 | $224,300 | $18,800 | $70,920 |
Source: Public Records
Map
Nearby Homes
- 375 Clark Creek Pass
- 821 Tramore Ct
- 632 Wexford Ct
- 5291 Clarkview Dr
- 4912 Lightwood Ct NW
- 1824 Lightwood Ln NW
- 821 Tramore Rd
- 5178 Centennial Creek View NW
- 1800 Baynard Ct NW
- 1994 Morning Walk NW
- 1996 Morning Walk NW
- 5384 Blackhawk Dr
- 2401 Nowlin Cir
- 4903 Wilkie Way NW
- 1908 Hamby Place Dr NW
- 0 Hamby Rd Unit 10651084
- 0 Hamby Rd Unit 7686326
- 5112 Centennial Creek View NW
- 104 Oak Pointe Ct NW
- 108 Oak Pointe Ct NW
- 110 Oak Pointe Ct NW
- 5098 Sherrer Dr NW
- 102 Oak Pointe Ct NW
- 109 Oak Pointe Ct NW
- 5102 Sherrer Dr NW
- 112 Oak Pointe Ct NW
- 100 Oak Pointe Ct NW
- 5106 Sherrer Dr NW
- 5090 Sherrer Dr NW
- 114 Oak Pointe Ct NW
- 115 Oak Pointe Ct NW
- 5126 Sherrer Dr NW
- 5095 Sherrer Dr NW
- 5091 Sherrer Dr NW
- 5099 Sherrer Dr NW
- 5110 Sherrer Dr NW
- 116 Oak Pointe Ct NW Unit 3
- 5086 Sherrer Dr NW