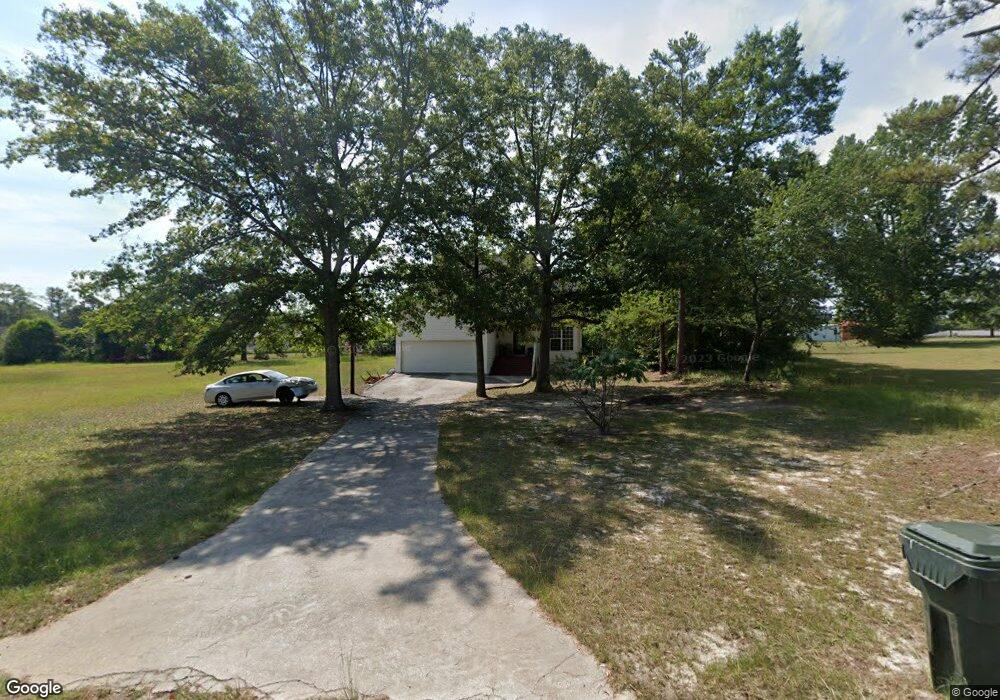
106 Park St Jeffersonville, GA 31044
Estimated Value: $141,000 - $205,000
4
Beds
2
Baths
2,002
Sq Ft
$89/Sq Ft
Est. Value
About This Home
This home is located at 106 Park St, Jeffersonville, GA 31044 and is currently estimated at $178,410, approximately $89 per square foot. 106 Park St is a home located in Twiggs County with nearby schools including Jeffersonville Elementary School, Twiggs Middle School, and Twiggs County High School.
Ownership History
Date
Name
Owned For
Owner Type
Purchase Details
Closed on
Jan 17, 2006
Sold by
Citifinancial Mtg Co Inc
Bought by
Cosby Narvis
Current Estimated Value
Home Financials for this Owner
Home Financials are based on the most recent Mortgage that was taken out on this home.
Original Mortgage
$57,000
Outstanding Balance
$37,982
Interest Rate
9.63%
Mortgage Type
New Conventional
Estimated Equity
$140,429
Purchase Details
Closed on
Sep 7, 2004
Sold by
Bond Curry S
Bought by
Citifinancial Mortgage Company Inc
Purchase Details
Closed on
Jul 18, 2000
Sold by
Hodges Katie B
Bought by
Hollingsworth Sandra
Purchase Details
Closed on
Jul 10, 2000
Sold by
Hollingsworth Sandra
Bought by
Bond Curry S
Purchase Details
Closed on
May 26, 1999
Sold by
Hodges W T
Bought by
Hollingsworth Sandra
Purchase Details
Closed on
Feb 27, 1978
Bought by
Hodges W T
Create a Home Valuation Report for This Property
The Home Valuation Report is an in-depth analysis detailing your home's value as well as a comparison with similar homes in the area
Home Values in the Area
Average Home Value in this Area
Purchase History
| Date | Buyer | Sale Price | Title Company |
|---|---|---|---|
| Cosby Narvis | $60,000 | -- | |
| Citifinancial Mortgage Company Inc | $75,000 | -- | |
| Hollingsworth Sandra | -- | -- | |
| Bond Curry S | -- | -- | |
| Hollingsworth Sandra | $9,000 | -- | |
| Hodges W T | -- | -- |
Source: Public Records
Mortgage History
| Date | Status | Borrower | Loan Amount |
|---|---|---|---|
| Open | Cosby Narvis | $57,000 |
Source: Public Records
Tax History Compared to Growth
Tax History
| Year | Tax Paid | Tax Assessment Tax Assessment Total Assessment is a certain percentage of the fair market value that is determined by local assessors to be the total taxable value of land and additions on the property. | Land | Improvement |
|---|---|---|---|---|
| 2024 | $1,724 | $54,146 | $3,200 | $50,946 |
| 2023 | $1,727 | $54,146 | $3,200 | $50,946 |
| 2022 | $1,959 | $54,146 | $3,200 | $50,946 |
| 2021 | $1,960 | $54,146 | $3,200 | $50,946 |
| 2020 | $1,960 | $54,146 | $3,200 | $50,946 |
| 2019 | $1,960 | $54,146 | $3,200 | $50,946 |
| 2018 | $1,798 | $54,146 | $3,200 | $50,946 |
| 2017 | $1,798 | $54,146 | $3,200 | $50,946 |
| 2016 | $0 | $50,946 | $0 | $50,946 |
| 2015 | -- | $54,146 | $3,200 | $50,946 |
| 2014 | -- | $54,146 | $3,200 | $50,946 |
| 2013 | -- | $55,934 | $3,200 | $52,734 |
Source: Public Records
Map
Nearby Homes
- 278 State Route 96
- 983 Main St
- 102 Morningside Dr
- 522 Main St
- 00 Riggins Mills Rd
- 00 Ac Ct
- 0 State Route 96
- 0 Georgia 18
- 434 N Main St
- 0 Riggins Mills Rd Unit 179911
- 2382 Gallimore Mill Rd
- 210 Balls Church Rd
- 7217 Ga Highway 18
- 0 District Rd Unit 181919
- 5222 State Route 96
- 0 Lucy Chapel Rd
- 239 Canton Rd
- 00 Jw Ashley Rd
- 1533 District Rd
- 309 Walnut St