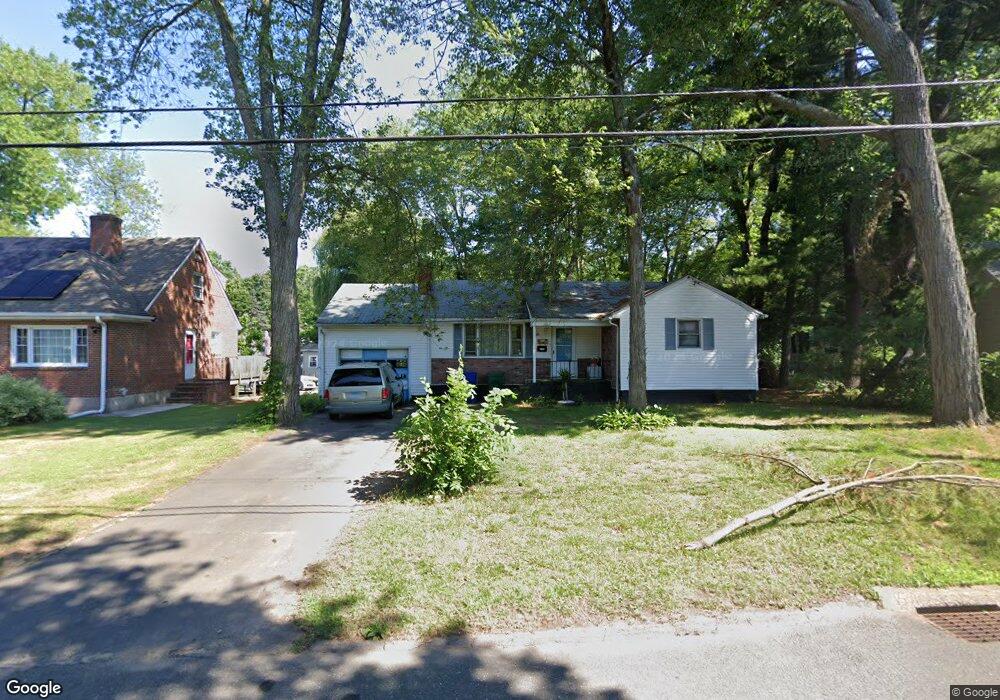
106 Pershing St Bloomfield, CT 06002
Blue Hills NeighborhoodEstimated Value: $211,000 - $274,000
3
Beds
1
Bath
1,047
Sq Ft
$236/Sq Ft
Est. Value
About This Home
This home is located at 106 Pershing St, Bloomfield, CT 06002 and is currently estimated at $247,424, approximately $236 per square foot. 106 Pershing St is a home located in Hartford County with nearby schools including Metacomet School, Carmen Arace Intermediate School, and Laurel School.
Ownership History
Date
Name
Owned For
Owner Type
Purchase Details
Closed on
Jul 14, 2009
Sold by
Sims Mack and Sims Eddie Mae
Bought by
Ross Jack
Current Estimated Value
Home Financials for this Owner
Home Financials are based on the most recent Mortgage that was taken out on this home.
Original Mortgage
$75,000
Outstanding Balance
$47,996
Interest Rate
4.93%
Mortgage Type
Purchase Money Mortgage
Estimated Equity
$199,428
Create a Home Valuation Report for This Property
The Home Valuation Report is an in-depth analysis detailing your home's value as well as a comparison with similar homes in the area
Home Values in the Area
Average Home Value in this Area
Purchase History
| Date | Buyer | Sale Price | Title Company |
|---|---|---|---|
| Ross Jack | $100,000 | -- | |
| Ross Jack | $100,000 | -- |
Source: Public Records
Mortgage History
| Date | Status | Borrower | Loan Amount |
|---|---|---|---|
| Open | Ross Jack | $75,000 | |
| Closed | Ross Jack | $75,000 |
Source: Public Records
Tax History
| Year | Tax Paid | Tax Assessment Tax Assessment Total Assessment is a certain percentage of the fair market value that is determined by local assessors to be the total taxable value of land and additions on the property. | Land | Improvement |
|---|---|---|---|---|
| 2025 | $4,550 | $117,460 | $18,200 | $99,260 |
| 2024 | $3,177 | $78,260 | $18,970 | $59,290 |
| 2023 | $3,121 | $78,260 | $18,970 | $59,290 |
| 2022 | $2,898 | $78,260 | $18,970 | $59,290 |
| 2021 | $2,980 | $78,260 | $18,970 | $59,290 |
| 2020 | $2,936 | $78,260 | $18,970 | $59,290 |
| 2019 | $3,127 | $78,260 | $18,970 | $59,290 |
| 2018 | $3,087 | $77,140 | $18,970 | $58,170 |
| 2017 | $3,090 | $77,140 | $18,970 | $58,170 |
| 2016 | $3,020 | $77,140 | $18,970 | $58,170 |
| 2015 | $2,970 | $77,140 | $18,970 | $58,170 |
| 2014 | $3,356 | $89,880 | $31,220 | $58,660 |
Source: Public Records
Map
Nearby Homes
- 97 Boothbay St
- 97 E Burnham St
- 26 Baltic St Unit 28
- 35 Baltic St
- 11 Pershing St Unit 13
- 13 Patton Rd
- 747 Blue Hills Ave
- 18 Darby St
- 200 Hartland St
- 86 Hartland St
- 90 Manchester St
- 110 Darby St
- 180 Brookline Ave
- 83 Colebrook St Unit 85
- 51 Pembroke St
- 171 N Canaan St
- 216 Cornwall St
- 57 Love Ln
- 275 Westland St
- 46 Risley St
- 104 Pershing St
- 108 Pershing St
- 102 Pershing St
- 103 Boothbay St
- 105 Boothbay St
- 101 Boothbay St
- 25 Mayfair Rd
- 100 Pershing St
- 101 Pershing St
- 107 Boothbay St
- 99 Boothbay St
- 110 Pershing St
- 23 Mayfair Rd
- 98 Pershing St
- 109 Boothbay St
- 14 Mayfair Ct
- 111 Pershing St
- 102 Boothbay St
- 21 Mayfair Rd
- 100 Boothbay St
Your Personal Tour Guide
Ask me questions while you tour the home.