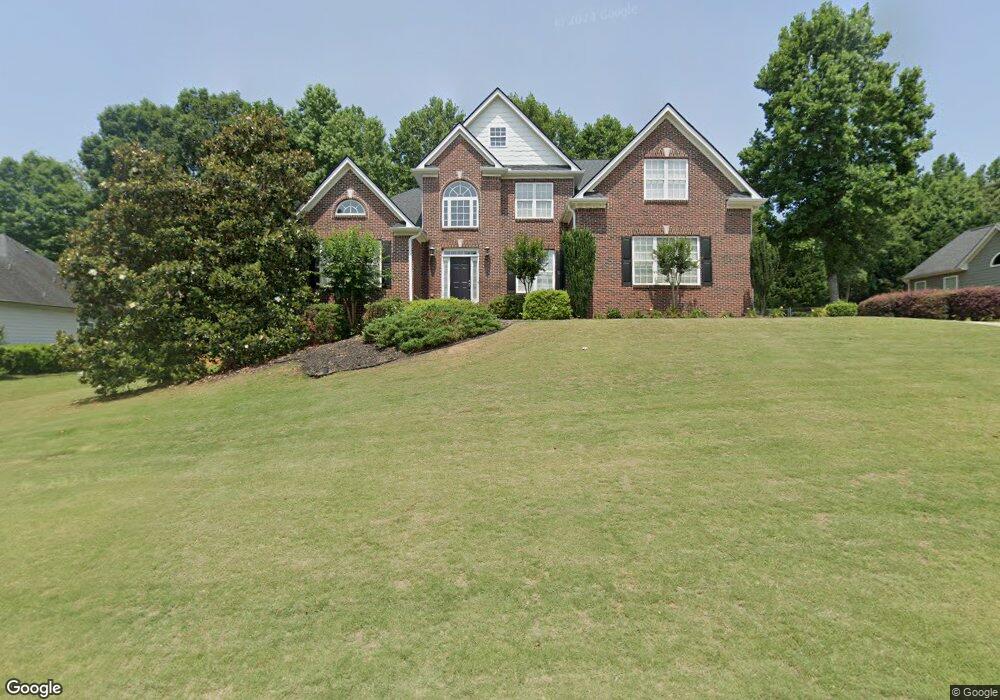
106 Prestwick Dr Hoschton, GA 30548
Estimated Value: $486,867 - $681,000
4
Beds
3
Baths
4,748
Sq Ft
$118/Sq Ft
Est. Value
About This Home
This home is located at 106 Prestwick Dr, Hoschton, GA 30548 and is currently estimated at $557,967, approximately $117 per square foot. 106 Prestwick Dr is a home located in Jackson County with nearby schools including Gum Springs Elementary School, West Jackson Middle School, and Jackson County High School.
Ownership History
Date
Name
Owned For
Owner Type
Purchase Details
Closed on
Feb 11, 2011
Sold by
The Bank Of New York Mello
Bought by
Benton Stephen D
Current Estimated Value
Home Financials for this Owner
Home Financials are based on the most recent Mortgage that was taken out on this home.
Original Mortgage
$183,315
Outstanding Balance
$123,758
Interest Rate
4.5%
Mortgage Type
FHA
Estimated Equity
$434,209
Purchase Details
Closed on
Oct 5, 2010
Sold by
Hutchinson Marc Douglas
Bought by
The Bank Of New York Mellon Trust Co Na
Purchase Details
Closed on
Jun 1, 2004
Sold by
Hutchinson Marc Douglas
Bought by
Hutchinson Marc Douglas
Purchase Details
Closed on
Nov 4, 2003
Sold by
Liberty Crest Properties Inc
Bought by
Tim Butler Homes Inc
Create a Home Valuation Report for This Property
The Home Valuation Report is an in-depth analysis detailing your home's value as well as a comparison with similar homes in the area
Home Values in the Area
Average Home Value in this Area
Purchase History
| Date | Buyer | Sale Price | Title Company |
|---|---|---|---|
| Benton Stephen D | $196,500 | -- | |
| The Bank Of New York Mellon Trust Co Na | -- | -- | |
| Hutchinson Marc Douglas | -- | -- | |
| Hutchinson Marc Douglas | $251,900 | -- | |
| Tim Butler Homes Inc | $45,000 | -- |
Source: Public Records
Mortgage History
| Date | Status | Borrower | Loan Amount |
|---|---|---|---|
| Open | Benton Stephen D | $183,315 |
Source: Public Records
Tax History Compared to Growth
Tax History
| Year | Tax Paid | Tax Assessment Tax Assessment Total Assessment is a certain percentage of the fair market value that is determined by local assessors to be the total taxable value of land and additions on the property. | Land | Improvement |
|---|---|---|---|---|
| 2024 | $4,589 | $172,040 | $20,480 | $151,560 |
| 2023 | $4,589 | $155,960 | $20,480 | $135,480 |
| 2022 | $3,952 | $130,520 | $20,480 | $110,040 |
| 2021 | $3,977 | $130,520 | $20,480 | $110,040 |
| 2020 | $3,686 | $111,320 | $20,480 | $90,840 |
| 2019 | $3,739 | $111,320 | $20,480 | $90,840 |
| 2018 | $3,629 | $106,720 | $20,480 | $86,240 |
| 2017 | $3,441 | $100,509 | $20,480 | $80,029 |
| 2016 | $3,521 | $100,509 | $20,480 | $80,029 |
| 2015 | $3,167 | $90,029 | $10,000 | $80,029 |
| 2014 | $2,942 | $85,365 | $10,000 | $75,365 |
| 2013 | -- | $85,365 | $10,000 | $75,365 |
Source: Public Records
Map
Nearby Homes
- 130 Prestwick Dr
- 82 Prestwick Dr
- 121 Prestwick Dr
- 97 Prestwick Dr
- 154 Prestwick Dr
- 58 Prestwick Dr
- 73 Prestwick Dr
- 147 Prestwick Dr
- 192 Montvale Dr
- 172 Montvale Dr
- 49 Prestwick Dr
- 178 Prestwick Dr
- 109 Southampton Cir
- 171 Prestwick Dr
- 216 Montvale Dr
- 124 Montvale Dr
- 133 Southampton Cir
- 25 Prestwick Dr
- 202 Prestwick Dr
- 195 Prestwick Dr