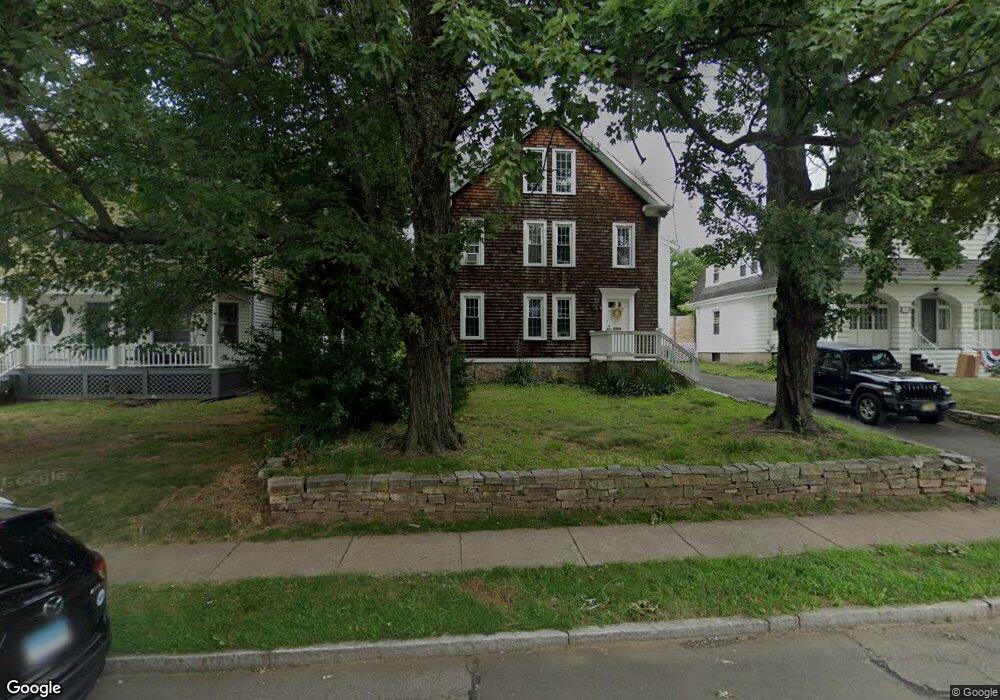
106 Quaker Ln S West Hartford, CT 06119
Estimated Value: $375,119 - $712,000
6
Beds
4
Baths
3,769
Sq Ft
$157/Sq Ft
Est. Value
About This Home
This home is located at 106 Quaker Ln S, West Hartford, CT 06119 and is currently estimated at $593,040, approximately $157 per square foot. 106 Quaker Ln S is a home located in Hartford County with nearby schools including Whiting Lane School, King Philip Middle School, and Hall High School.
Ownership History
Date
Name
Owned For
Owner Type
Purchase Details
Closed on
Aug 17, 2015
Sold by
Obrien Isabella K
Bought by
Obrien Daniel P and Obrien Isabella K
Current Estimated Value
Purchase Details
Closed on
Mar 30, 2015
Sold by
Obrien Daniel P
Bought by
Obrien Isabella K
Home Financials for this Owner
Home Financials are based on the most recent Mortgage that was taken out on this home.
Original Mortgage
$255,000
Interest Rate
3.68%
Purchase Details
Closed on
Mar 3, 2014
Sold by
106 South Quaker Lane
Bought by
Obrien Isabella K and Obrien Daniel P
Home Financials for this Owner
Home Financials are based on the most recent Mortgage that was taken out on this home.
Original Mortgage
$276,750
Interest Rate
4.39%
Purchase Details
Closed on
Mar 27, 1998
Sold by
Grenier Jeannine
Bought by
Cameron Curt A
Home Financials for this Owner
Home Financials are based on the most recent Mortgage that was taken out on this home.
Original Mortgage
$120,000
Interest Rate
6.75%
Mortgage Type
Unknown
Create a Home Valuation Report for This Property
The Home Valuation Report is an in-depth analysis detailing your home's value as well as a comparison with similar homes in the area
Home Values in the Area
Average Home Value in this Area
Purchase History
| Date | Buyer | Sale Price | Title Company |
|---|---|---|---|
| Obrien Daniel P | -- | -- | |
| Obrien Isabella K | -- | -- | |
| Obrien Isabella K | -- | -- | |
| Cameron Curt A | $120,000 | -- |
Source: Public Records
Mortgage History
| Date | Status | Borrower | Loan Amount |
|---|---|---|---|
| Previous Owner | Obrien Isabella K | $255,000 | |
| Previous Owner | Obrien Isabella K | $276,750 | |
| Previous Owner | Cameron Curt A | $109,346 | |
| Previous Owner | Cameron Curt A | $120,000 | |
| Previous Owner | Cameron Curt A | $100,000 | |
| Previous Owner | Cameron Curt A | $50,000 |
Source: Public Records
Tax History Compared to Growth
Tax History
| Year | Tax Paid | Tax Assessment Tax Assessment Total Assessment is a certain percentage of the fair market value that is determined by local assessors to be the total taxable value of land and additions on the property. | Land | Improvement |
|---|---|---|---|---|
| 2025 | $14,536 | $324,620 | $80,600 | $244,020 |
| 2024 | $13,748 | $324,620 | $80,600 | $244,020 |
| 2023 | $13,283 | $324,620 | $80,600 | $244,020 |
| 2022 | $13,206 | $324,620 | $80,600 | $244,020 |
| 2021 | $12,525 | $295,260 | $79,400 | $215,860 |
| 2020 | $12,342 | $295,260 | $68,100 | $227,160 |
| 2019 | $12,342 | $295,260 | $68,110 | $227,150 |
| 2018 | $12,106 | $295,260 | $68,110 | $227,150 |
| 2017 | $12,117 | $295,260 | $68,110 | $227,150 |
| 2016 | $9,450 | $239,190 | $50,890 | $188,300 |
| 2015 | $9,163 | $239,190 | $50,890 | $188,300 |
| 2014 | $8,939 | $239,190 | $50,890 | $188,300 |
Source: Public Records
Map
Nearby Homes
- 53 Quaker Ln S
- 40 Garden Ln
- 16 Lilley Rd
- 23 Price Blvd
- 18 Robin Rd Unit 1
- 4 Frederick Rd
- 26 Robin Rd Unit 3
- 889 Farmington Ave Unit 4E
- 31 Robin Rd Unit 102
- 54 Robin Rd Unit B2
- 6 W Hill Dr
- 10 Farnham Rd
- 12 Farnham Rd
- 287 Whiting Ln
- 760 Trout Brook Dr
- 24 Troy St
- 45 Fairlawn St
- 51 Bretton Rd
- 8 Lexington Rd
- 209 Warrenton Ave
- 103 Quaker Ln S
- 100 Quaker Ln S
- 114 Quaker Ln S
- 96 Quaker Ln S
- 120 Quaker Ln S
- 105 Maplewood Ave
- 105 Maplewood Ave Unit 3
- 92 Quaker Ln S
- 109 Maplewood Ave
- 118 Quaker Ln S
- 118 Quaker Ln S Unit 3rd floor
- 101 Maplewood Ave
- 115 Maplewood Ave
- 101 Quaker Ln S
- 105 Quaker Ln S
- 119 Maplewood Ave
- 97 Quaker Ln S
- 88 Quaker Ln S
- 109 Quaker Ln S
- 99 Maplewood Ave Unit 2