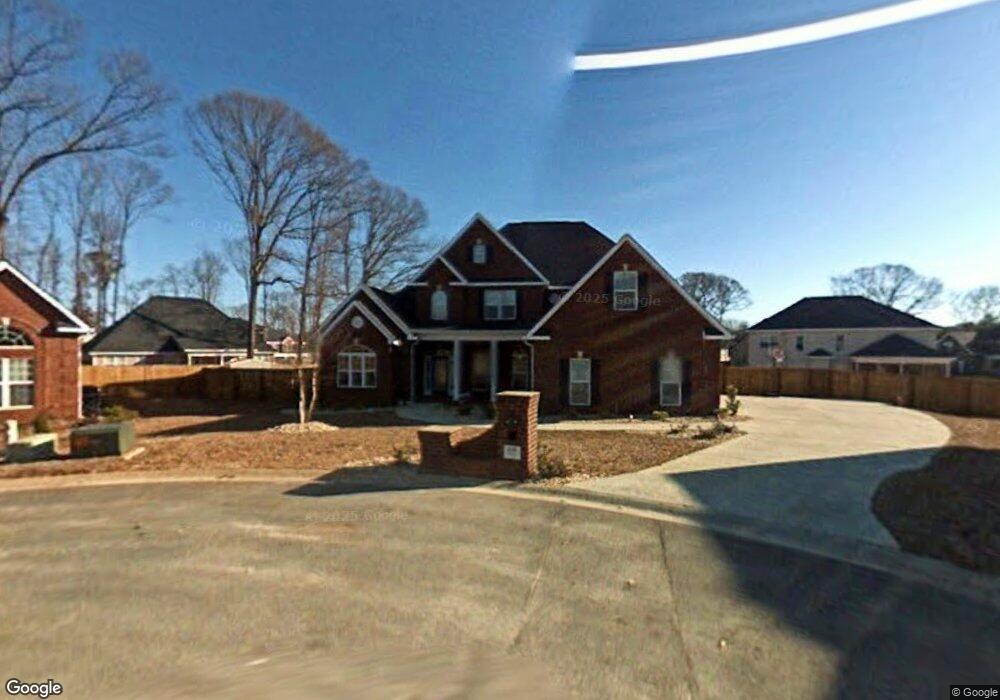
106 Quinn Ct Warner Robins, GA 31088
Estimated Value: $427,997 - $550,000
4
Beds
4
Baths
3,539
Sq Ft
$141/Sq Ft
Est. Value
About This Home
This home is located at 106 Quinn Ct, Warner Robins, GA 31088 and is currently estimated at $498,999, approximately $141 per square foot. 106 Quinn Ct is a home located in Houston County with nearby schools including Lake Joy Primary School, Lake Joy Elementary School, and Mossy Creek Middle School.
Ownership History
Date
Name
Owned For
Owner Type
Purchase Details
Closed on
Aug 28, 2006
Sold by
Premiere Construction Of Middle Georgia
Bought by
Lunceford George A and Lunceford April M
Current Estimated Value
Purchase Details
Closed on
Apr 15, 2005
Sold by
Sctc Development Llc
Bought by
Premier Construction Of Middle Ga
Purchase Details
Closed on
Mar 4, 2005
Sold by
Ncw Inc
Bought by
Sctc Development Llc
Create a Home Valuation Report for This Property
The Home Valuation Report is an in-depth analysis detailing your home's value as well as a comparison with similar homes in the area
Home Values in the Area
Average Home Value in this Area
Purchase History
| Date | Buyer | Sale Price | Title Company |
|---|---|---|---|
| Lunceford George A | -- | None Available | |
| Premier Construction Of Middle Ga | $35,000 | -- | |
| Sctc Development Llc | $23,500 | -- |
Source: Public Records
Tax History Compared to Growth
Tax History
| Year | Tax Paid | Tax Assessment Tax Assessment Total Assessment is a certain percentage of the fair market value that is determined by local assessors to be the total taxable value of land and additions on the property. | Land | Improvement |
|---|---|---|---|---|
| 2024 | $5,057 | $155,920 | $14,000 | $141,920 |
| 2023 | $4,452 | $136,400 | $14,000 | $122,400 |
| 2022 | $2,977 | $131,480 | $14,000 | $117,480 |
| 2021 | $2,662 | $117,160 | $14,000 | $103,160 |
| 2020 | $2,515 | $110,240 | $14,000 | $96,240 |
| 2019 | $2,515 | $110,240 | $14,000 | $96,240 |
| 2018 | $2,450 | $107,440 | $11,200 | $96,240 |
| 2017 | $2,452 | $107,440 | $11,200 | $96,240 |
| 2016 | $2,456 | $107,440 | $11,200 | $96,240 |
| 2015 | -- | $106,720 | $11,200 | $95,520 |
| 2014 | -- | $106,720 | $11,200 | $95,520 |
| 2013 | -- | $109,520 | $11,200 | $98,320 |
Source: Public Records
Map
Nearby Homes