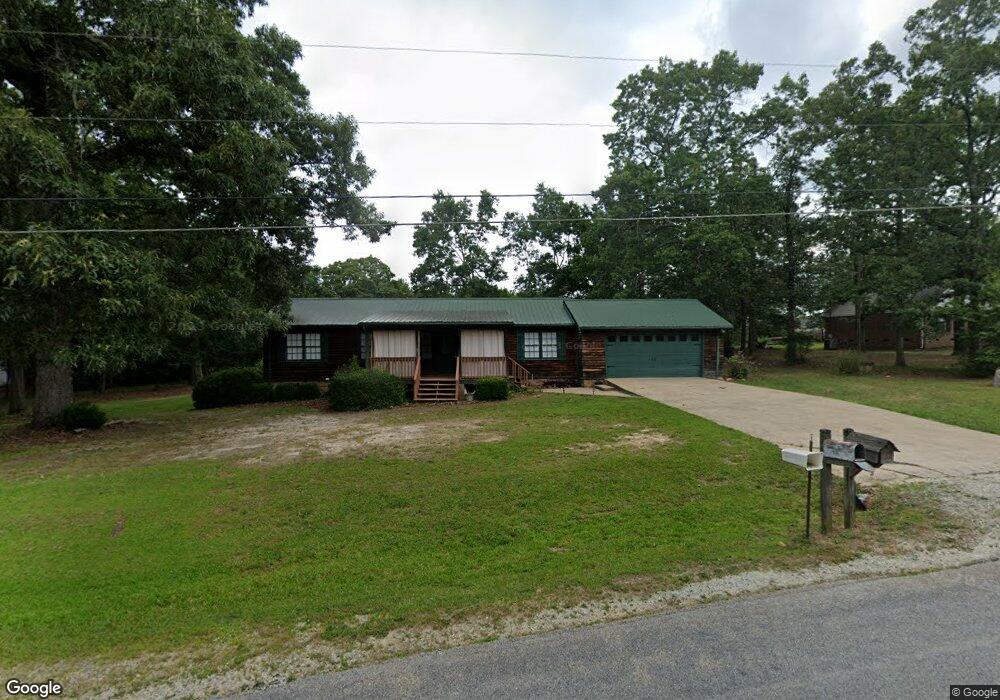
106 Red Leaf Rd Hartwell, GA 30643
Estimated Value: $243,000 - $307,000
2
Beds
2
Baths
1,100
Sq Ft
$244/Sq Ft
Est. Value
About This Home
This home is located at 106 Red Leaf Rd, Hartwell, GA 30643 and is currently estimated at $268,102, approximately $243 per square foot. 106 Red Leaf Rd is a home located in Hart County with nearby schools including Hart County High School.
Ownership History
Date
Name
Owned For
Owner Type
Purchase Details
Closed on
May 28, 2021
Sold by
Frye Patricia D Irrev Mit Trust
Bought by
Brown Karen M
Current Estimated Value
Home Financials for this Owner
Home Financials are based on the most recent Mortgage that was taken out on this home.
Original Mortgage
$95,000
Outstanding Balance
$71,157
Interest Rate
2.9%
Mortgage Type
New Conventional
Estimated Equity
$196,945
Purchase Details
Closed on
Dec 19, 2011
Sold by
Frame Patricia D
Bought by
Frame Patricia D
Purchase Details
Closed on
Nov 20, 2007
Sold by
Wiggins Shea
Bought by
Frame Patricia D
Purchase Details
Closed on
Jul 18, 2007
Sold by
Us National Association
Bought by
Wiggins Shea
Purchase Details
Closed on
Nov 7, 2006
Sold by
Hart Andrew J
Bought by
Us Bank National Association T
Purchase Details
Closed on
Nov 1, 2004
Purchase Details
Closed on
Sep 1, 1983
Purchase Details
Closed on
Dec 1, 1979
Create a Home Valuation Report for This Property
The Home Valuation Report is an in-depth analysis detailing your home's value as well as a comparison with similar homes in the area
Home Values in the Area
Average Home Value in this Area
Purchase History
| Date | Buyer | Sale Price | Title Company |
|---|---|---|---|
| Brown Karen M | $125,000 | -- | |
| Frame Patricia D | -- | -- | |
| Frame Patricia D | $110,000 | -- | |
| Wiggins Shea | $62,500 | -- | |
| Us Bank National Association T | -- | -- | |
| -- | $74,000 | -- | |
| -- | $47,500 | -- | |
| -- | $9,500 | -- | |
| -- | -- | -- |
Source: Public Records
Mortgage History
| Date | Status | Borrower | Loan Amount |
|---|---|---|---|
| Open | Brown Karen M | $95,000 |
Source: Public Records
Tax History Compared to Growth
Tax History
| Year | Tax Paid | Tax Assessment Tax Assessment Total Assessment is a certain percentage of the fair market value that is determined by local assessors to be the total taxable value of land and additions on the property. | Land | Improvement |
|---|---|---|---|---|
| 2024 | $1,046 | $69,674 | $10,000 | $59,674 |
| 2023 | $1,023 | $61,437 | $10,000 | $51,437 |
| 2022 | $833 | $52,230 | $6,400 | $45,830 |
| 2021 | $731 | $39,409 | $6,400 | $33,009 |
| 2020 | $736 | $38,016 | $6,400 | $31,616 |
| 2019 | $702 | $35,903 | $5,200 | $30,703 |
| 2018 | $718 | $36,305 | $5,200 | $31,105 |
| 2017 | $715 | $35,974 | $5,200 | $30,774 |
| 2016 | $744 | $36,270 | $5,200 | $31,070 |
| 2015 | $694 | $35,664 | $4,800 | $30,864 |
| 2014 | $688 | $34,637 | $4,800 | $29,837 |
| 2013 | -- | $35,443 | $4,800 | $30,643 |
Source: Public Records
Map
Nearby Homes
- 2850 Mount Hebron Rd
- 148 Swan Sanders Rd
- 2868 Mount Hebron Rd
- 0 N Point Cir Unit 7663006
- 153 N Point Cir
- 479 N Point Cir
- 251 N Point Cir
- 247 N Point Cir
- 323 N Point Cir
- 328 Walnut Dr
- 3034 Mount Hebron Rd
- 220 Tuscarora Trail
- 366 Curt Bailey Rd
- 330 Ivy Trail
- 0 Sunflower Dr Unit 10590900
- 0 Curt Bailey Rd Unit 10576459
- 0 Curt Bailey Rd Unit 10575247
- LOT E2 Nylah Ln
- LOT E1 Nylah Ln
- 40 Crest Dr Unit 24
- 76 Red Leaf Rd
- 138 Red Leaf Rd
- 111 Red Leaf Rd
- 79 Red Leaf Rd
- 141 Red Leaf Rd
- 58 Red Leaf Rd
- 160 Red Leaf Rd
- 5169 Reed Creek Hwy
- 385 Red Leaf Rd
- 173 Red Leaf Rd
- 25 Red Leaf Rd
- 22 Red Leaf Rd
- 427 Red Leaf Rd
- 5173 Reed Creek Hwy
- 0 Red Leaf Rd Unit 8235109
- 0 Red Leaf Rd Unit LOT 26 7293252
- 0 Red Leaf Rd Unit LOT 27 7293249
- 0 Red Leaf Rd Unit LOT 12 7293209
- 0 Red Leaf Rd Unit LOT 25 7293238
- 0 Red Leaf Rd Unit LOT 10 7293204