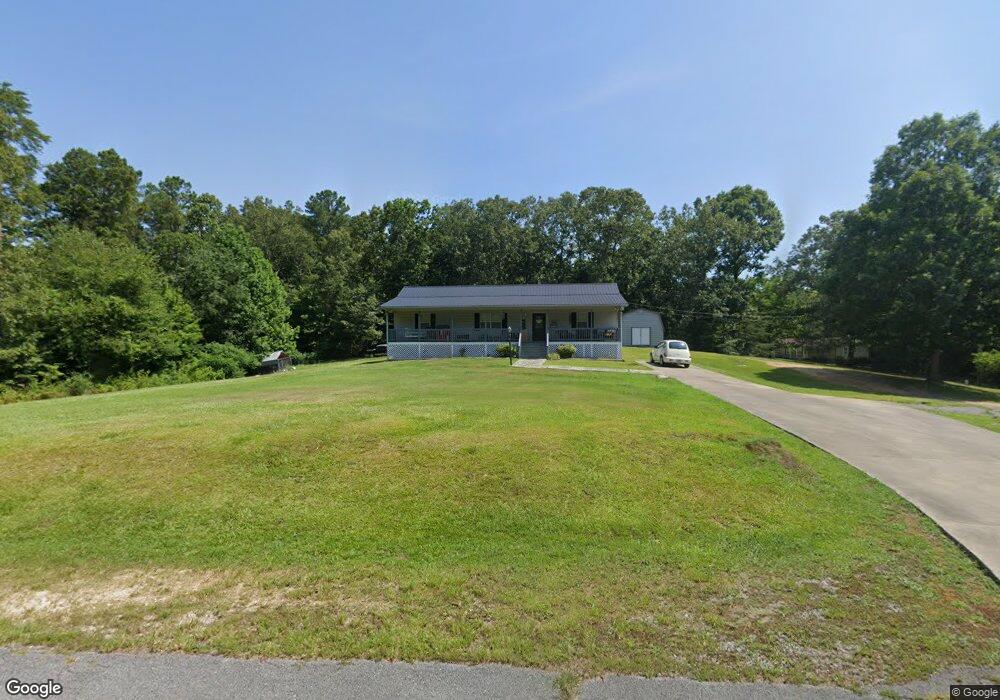
106 Red Oak Dr La Fayette, GA 30728
Estimated Value: $241,000 - $298,000
4
Beds
3
Baths
1,804
Sq Ft
$148/Sq Ft
Est. Value
About This Home
This home is located at 106 Red Oak Dr, La Fayette, GA 30728 and is currently estimated at $267,667, approximately $148 per square foot. 106 Red Oak Dr is a home located in Walker County with nearby schools including Gilbert Elementary School, Lafayette Middle School, and Lafayette High School.
Ownership History
Date
Name
Owned For
Owner Type
Purchase Details
Closed on
Jan 19, 2004
Sold by
Everett Norma J
Bought by
Hampton Bryan D and Hampton Tara N
Current Estimated Value
Purchase Details
Closed on
Jul 6, 2001
Sold by
Durkan Thomas
Bought by
Everett Norma J
Purchase Details
Closed on
Nov 29, 2000
Sold by
Secretary Of Housing & Urban
Bought by
Durkan Thomas
Purchase Details
Closed on
Aug 1, 2000
Sold by
Homeside Lending Inc
Bought by
Secretary Of Housing & Urban
Purchase Details
Closed on
Nov 4, 1996
Sold by
Forrest Dennis M
Bought by
Forrest Dennis M and Forrest Gail
Purchase Details
Closed on
Jul 18, 1996
Sold by
Star Quality Homes Inc
Bought by
Forrest Dennis M
Purchase Details
Closed on
Mar 8, 1996
Sold by
Young Wendell
Bought by
Star Quality Homes Inc
Purchase Details
Closed on
Aug 31, 1984
Sold by
Clara Vandusen G and Clara Jean
Bought by
Young Wendell
Purchase Details
Closed on
Dec 8, 1980
Bought by
Clara Vandusen G and Clara Jean
Create a Home Valuation Report for This Property
The Home Valuation Report is an in-depth analysis detailing your home's value as well as a comparison with similar homes in the area
Home Values in the Area
Average Home Value in this Area
Purchase History
| Date | Buyer | Sale Price | Title Company |
|---|---|---|---|
| Hampton Bryan D | $80,700 | -- | |
| Everett Norma J | $83,900 | -- | |
| Durkan Thomas | -- | -- | |
| Secretary Of Housing & Urban | -- | -- | |
| Homeside Lending Inc | -- | -- | |
| Forrest Dennis M | -- | -- | |
| Forrest Dennis M | -- | -- | |
| Star Quality Homes Inc | -- | -- | |
| Young Wendell | -- | -- | |
| Clara Vandusen G | $1,500 | -- |
Source: Public Records
Tax History Compared to Growth
Tax History
| Year | Tax Paid | Tax Assessment Tax Assessment Total Assessment is a certain percentage of the fair market value that is determined by local assessors to be the total taxable value of land and additions on the property. | Land | Improvement |
|---|---|---|---|---|
| 2024 | $1,730 | $74,746 | $8,035 | $66,711 |
| 2023 | $1,651 | $69,497 | $6,377 | $63,120 |
| 2022 | $1,453 | $56,806 | $2,651 | $54,155 |
| 2021 | $1,303 | $45,652 | $2,651 | $43,001 |
| 2020 | $1,093 | $36,207 | $2,651 | $33,556 |
| 2019 | $1,111 | $36,207 | $2,651 | $33,556 |
| 2018 | $958 | $36,207 | $2,651 | $33,556 |
| 2017 | $1,363 | $41,278 | $7,722 | $33,556 |
| 2016 | $1,091 | $41,278 | $7,722 | $33,556 |
| 2015 | $1,184 | $42,471 | $4,000 | $38,471 |
| 2014 | $1,086 | $42,471 | $4,000 | $38,471 |
| 2013 | -- | $42,470 | $4,000 | $38,470 |
Source: Public Records
Map
Nearby Homes
- 334 S Oakland Dr
- 300 Bronco Rd
- 1152 Magnolia St
- 1103 Sisemore St
- 1125 S Chattanooga St
- 308 Pledger Pkwy
- 39 Cook St
- 100 Lake Terrace Dr
- 221 Chota Cir
- 24605 Highway 193
- Perry Plan at Lake Terrace
- Sullivan Plan at Lake Terrace
- Lewis Plan at Lake Terrace
- Curtis Plan at Lake Terrace
- Edmon Plan at Lake Terrace
- Wyeth Plan at Lake Terrace
- 908 Gilbert Ln
- 0 Indiana St Unit 28 10583802
- 1002 Colerain St
- 1314 W Main St
- 18 Red Oak Dr
- 142 S Oakland Dr
- 113 Red Oak Dr
- 13 Red Oak Dr
- 120 S Oakland Dr
- 0 S Oakland Dr Unit 931824
- 0 S Oakland Dr
- 232 S Oakland Dr
- 196 S Oakland Dr
- 100 S Oakland Dr
- 110 S Oakland Dr
- 176 S Oakland Dr
- 139 S Oakland Dr
- S S Oakland Dr
- 159 S Oakland Dr
- 101 S Oakland Dr
- 161 S Oakland Dr
- 104 S Oakland Dr
- 104 S Oakland Dr Unit AA
- 185 S Oakland Dr