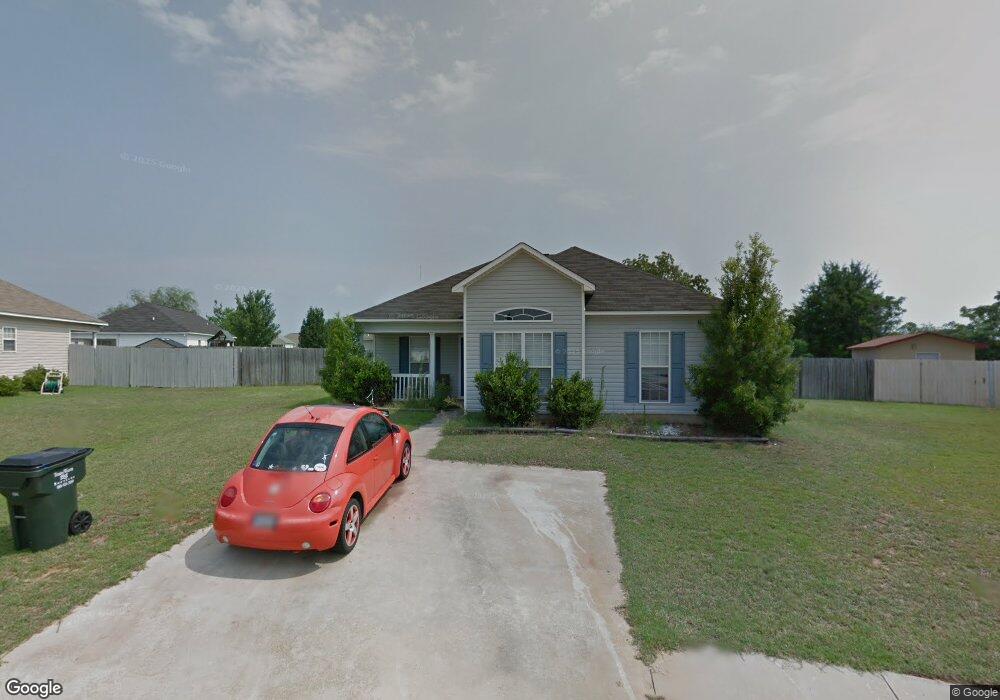
106 Rex Ct Warner Robins, GA 31088
Estimated Value: $200,000 - $205,000
Studio
--
Bath
1,194
Sq Ft
$170/Sq Ft
Est. Value
About This Home
This home is located at 106 Rex Ct, Warner Robins, GA 31088 and is currently estimated at $202,908, approximately $169 per square foot. 106 Rex Ct is a home located in Houston County with nearby schools including David A. Perdue Primary School, David A. Perdue Elementary School, and Feagin Mill Middle School.
Ownership History
Date
Name
Owned For
Owner Type
Purchase Details
Closed on
Mar 25, 2013
Sold by
Rocha Edward J and Rocha Kristure H
Bought by
Rocha Edward J and Rocha Kristure H
Current Estimated Value
Home Financials for this Owner
Home Financials are based on the most recent Mortgage that was taken out on this home.
Original Mortgage
$73,000
Outstanding Balance
$50,669
Interest Rate
3.56%
Mortgage Type
New Conventional
Estimated Equity
$152,239
Purchase Details
Closed on
Jun 30, 2005
Sold by
Bell Dustin L and Rebecca Ann*
Bought by
Rocha Edward J and Rocha Kristure H
Purchase Details
Closed on
Feb 22, 2005
Sold by
Bell Dustin L
Bought by
Bell Dustin L and Bell Rebecca Ann B
Purchase Details
Closed on
Dec 15, 2003
Sold by
Pinnacle Residential Dev Inc
Bought by
Bell Dustin L
Purchase Details
Closed on
Feb 14, 2003
Sold by
The Aspen Company
Bought by
Pinnacle Residential Dev Inc
Create a Home Valuation Report for This Property
The Home Valuation Report is an in-depth analysis detailing your home's value as well as a comparison with similar homes in the area
Home Values in the Area
Average Home Value in this Area
Purchase History
| Date | Buyer | Sale Price | Title Company |
|---|---|---|---|
| Rocha Edward J | -- | None Available | |
| Rocha Edward J | $86,600 | -- | |
| Bell Dustin L | -- | None Available | |
| Bell Dustin L | $81,000 | -- | |
| Pinnacle Residential Dev Inc | $15,900 | -- |
Source: Public Records
Mortgage History
| Date | Status | Borrower | Loan Amount |
|---|---|---|---|
| Open | Rocha Edward J | $73,000 |
Source: Public Records
Tax History
| Year | Tax Paid | Tax Assessment Tax Assessment Total Assessment is a certain percentage of the fair market value that is determined by local assessors to be the total taxable value of land and additions on the property. | Land | Improvement |
|---|---|---|---|---|
| 2025 | $1,947 | $66,840 | $10,800 | $56,040 |
| 2024 | $1,997 | $61,040 | $9,600 | $51,440 |
| 2023 | $1,728 | $52,400 | $8,800 | $43,600 |
| 2022 | $1,052 | $45,760 | $8,800 | $36,960 |
| 2021 | $944 | $40,840 | $8,800 | $32,040 |
| 2020 | $863 | $37,160 | $8,800 | $28,360 |
| 2019 | $863 | $37,160 | $8,800 | $28,360 |
| 2018 | $764 | $32,880 | $6,000 | $26,880 |
| 2017 | $765 | $32,880 | $6,000 | $26,880 |
| 2016 | $771 | $33,120 | $6,000 | $27,120 |
| 2015 | -- | $33,520 | $6,000 | $27,520 |
| 2014 | -- | $33,520 | $6,000 | $27,520 |
| 2013 | -- | $33,520 | $6,000 | $27,520 |
Source: Public Records
Map
Nearby Homes
- 416 Bella Notte Cir
- 409 Bella Notte Cir Unit 1D
- 409 Bella Notte Cir
- 504 Haverhill Cir
- 414 Bella Notte Cir
- 414 Bella Notte Cir Unit 23A
- 316 Haverhill Cir
- 500 Bella Notte Cir Unit 16A
- 500 Bella Notte Cir
- 502 Bella Notte Cir
- 502 Bella Notte Cir Unit 15A
- 401 Bella Notte Cir Unit 5D
- 401 Bella Notte Cir
- 404 Minter Dr
- 113 Jana Ct
- 213 Air Park Dr
- 0 Feagin Mill Rd Unit 10572748
- 0 Feagin Mill Rd Unit 254957
- 0 Feagin Mill Rd Unit 180689
- 108 Holbeck Ct
Your Personal Tour Guide
Ask me questions while you tour the home.