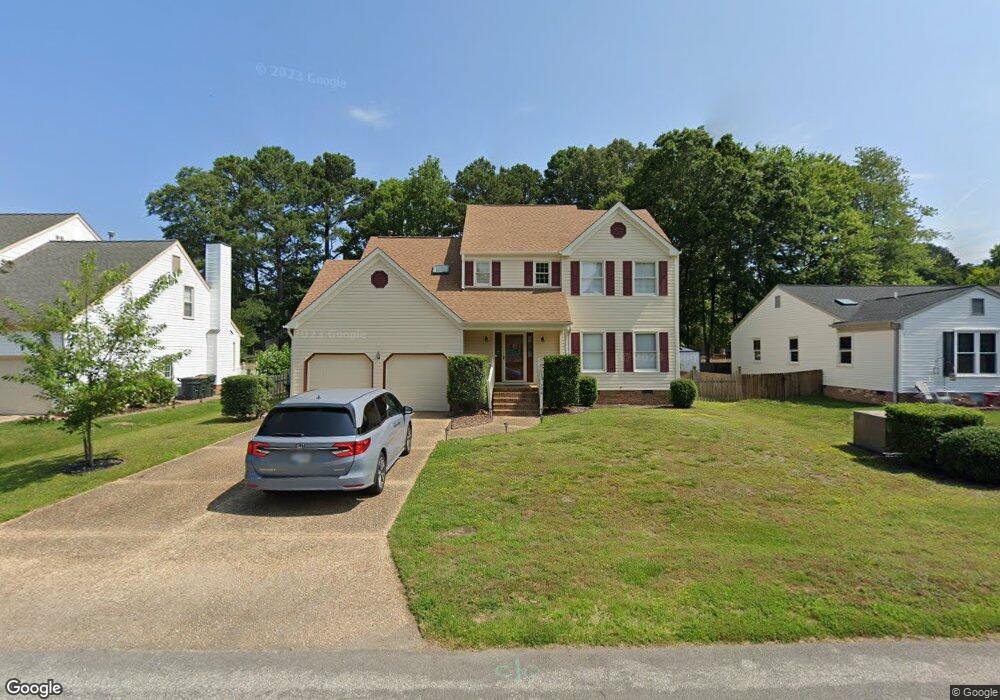
106 Richard Run Unit 1 Yorktown, VA 23693
Tabb NeighborhoodEstimated Value: $518,928 - $531,000
4
Beds
3
Baths
2,520
Sq Ft
$208/Sq Ft
Est. Value
About This Home
This home is located at 106 Richard Run Unit 1, Yorktown, VA 23693 and is currently estimated at $524,232, approximately $208 per square foot. 106 Richard Run Unit 1 is a home located in York County with nearby schools including Coventry Elementary School, Grafton Middle School, and Grafton High School.
Ownership History
Date
Name
Owned For
Owner Type
Purchase Details
Closed on
May 15, 2024
Sold by
Bienfang Mary K
Bought by
Barker James Brendon and Barker Lisa
Current Estimated Value
Home Financials for this Owner
Home Financials are based on the most recent Mortgage that was taken out on this home.
Original Mortgage
$374,625
Outstanding Balance
$369,588
Interest Rate
7.1%
Mortgage Type
VA
Estimated Equity
$154,644
Purchase Details
Closed on
Feb 21, 2005
Sold by
Geiger Michael J
Bought by
Bienfang Mary K
Home Financials for this Owner
Home Financials are based on the most recent Mortgage that was taken out on this home.
Original Mortgage
$240,000
Interest Rate
5.64%
Mortgage Type
New Conventional
Purchase Details
Closed on
Sep 17, 2001
Sold by
Sullivan Thomas G
Bought by
Geiger Michael J
Home Financials for this Owner
Home Financials are based on the most recent Mortgage that was taken out on this home.
Original Mortgage
$155,200
Interest Rate
6.99%
Create a Home Valuation Report for This Property
The Home Valuation Report is an in-depth analysis detailing your home's value as well as a comparison with similar homes in the area
Home Values in the Area
Average Home Value in this Area
Purchase History
| Date | Buyer | Sale Price | Title Company |
|---|---|---|---|
| Barker James Brendon | $470,000 | First American Title | |
| Bienfang Mary K | $300,000 | -- | |
| Geiger Michael J | $194,000 | -- |
Source: Public Records
Mortgage History
| Date | Status | Borrower | Loan Amount |
|---|---|---|---|
| Open | Barker James Brendon | $374,625 | |
| Previous Owner | Bienfang Mary K | $240,000 | |
| Previous Owner | Geiger Michael J | $155,200 |
Source: Public Records
Tax History Compared to Growth
Tax History
| Year | Tax Paid | Tax Assessment Tax Assessment Total Assessment is a certain percentage of the fair market value that is determined by local assessors to be the total taxable value of land and additions on the property. | Land | Improvement |
|---|---|---|---|---|
| 2025 | $3,623 | $489,600 | $140,000 | $349,600 |
| 2024 | $3,623 | $489,600 | $140,000 | $349,600 |
| 2023 | $2,941 | $381,900 | $120,000 | $261,900 |
| 2022 | $2,979 | $381,900 | $120,000 | $261,900 |
| 2021 | $2,676 | $336,600 | $115,000 | $221,600 |
| 2020 | $2,676 | $336,600 | $115,000 | $221,600 |
| 2019 | $3,837 | $336,600 | $115,000 | $221,600 |
| 2018 | $3,837 | $336,600 | $115,000 | $221,600 |
| 2017 | $2,530 | $336,600 | $115,000 | $221,600 |
| 2016 | -- | $336,600 | $115,000 | $221,600 |
| 2015 | -- | $318,500 | $115,000 | $203,500 |
| 2014 | -- | $318,500 | $115,000 | $203,500 |
Source: Public Records
Map
Nearby Homes
- 105 Richard Run
- 305 Peachtree Ln
- 107 Sheldon Ct
- 410 Richter Ln
- 115 Seekright Dr
- 301 Judith Cir
- 2019 George Washington Memorial Hwy
- 407 Honeysuckle Ln
- 229 Judith Cir
- 105 Kensington Place
- 207 Andover Ct
- 103 Kensington Place
- 206 Andover Ct
- 107 Andover Ct
- 113 Lochmere Ct
- 101 Chadwick Ct
- 615 Commonwealth Dr
- 613 Commonwealth Dr
- 611 Commonwealth Dr
- 818 Miller Creek Ln
- 106 Richard Run
- 108 Richard Run
- 104 Richard Run
- 110 Elise Place
- 312 Gardenville Dr
- 108 Elise Place
- 100 Richard Run
- 310 Gardenville Dr
- 107 Richard Run
- 103 Richard Run
- 109 Richard Run
- 308 Gardenville Dr
- 111 Elise Place
- 106 Elise Place
- 101 Richard Run
- 111 Richard Run
- 114 Richard Run
- 306 Gardenville Dr
- 113 Richard Run
- 104 Elise Place