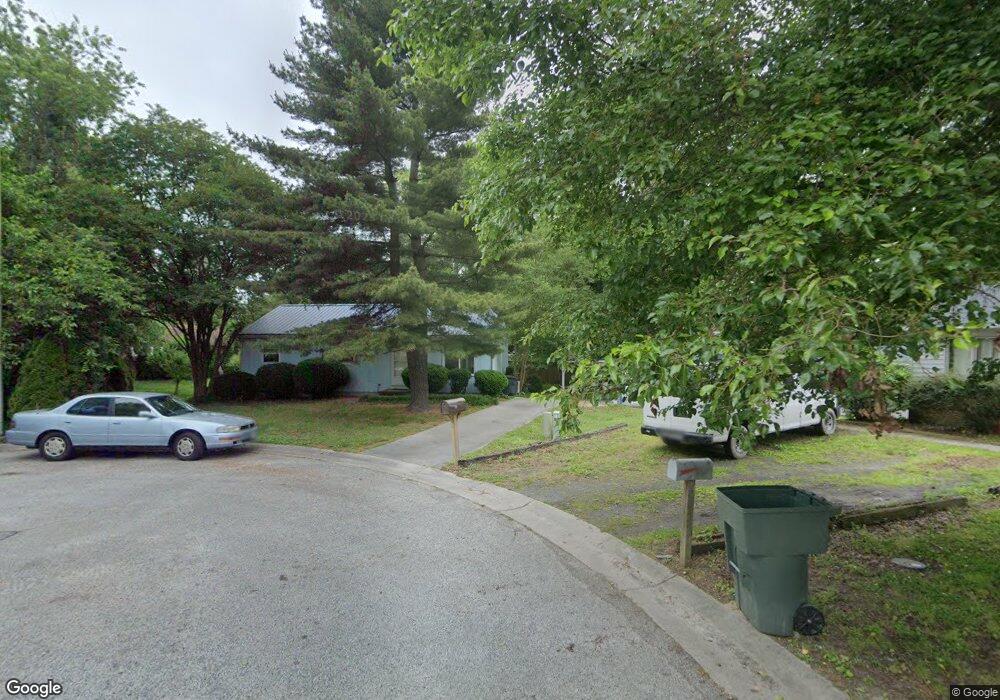
106 Rickover Ct Salisbury, MD 21804
South Salisbury NeighborhoodEstimated Value: $170,807 - $225,000
--
Bed
1
Bath
960
Sq Ft
$215/Sq Ft
Est. Value
About This Home
This home is located at 106 Rickover Ct, Salisbury, MD 21804 and is currently estimated at $206,452, approximately $215 per square foot. 106 Rickover Ct is a home located in Wicomico County with nearby schools including Prince Street Elementary School, Bennett Middle School, and James M. Bennett High School.
Ownership History
Date
Name
Owned For
Owner Type
Purchase Details
Closed on
Mar 7, 2018
Sold by
Cooper William H and Cooper Patricia L
Bought by
Cooper Gary
Current Estimated Value
Purchase Details
Closed on
Aug 17, 1993
Sold by
Walston Randall L
Bought by
Cooper Gary and Cooper William H
Home Financials for this Owner
Home Financials are based on the most recent Mortgage that was taken out on this home.
Original Mortgage
$51,200
Interest Rate
7.17%
Purchase Details
Closed on
Oct 16, 1989
Sold by
Duer Julie V
Bought by
Walston Randall L
Home Financials for this Owner
Home Financials are based on the most recent Mortgage that was taken out on this home.
Original Mortgage
$57,850
Interest Rate
9.95%
Purchase Details
Closed on
Oct 29, 1985
Sold by
Rutland Heights Dev Co
Bought by
Duer Julie
Create a Home Valuation Report for This Property
The Home Valuation Report is an in-depth analysis detailing your home's value as well as a comparison with similar homes in the area
Home Values in the Area
Average Home Value in this Area
Purchase History
| Date | Buyer | Sale Price | Title Company |
|---|---|---|---|
| Cooper Gary | -- | None Available | |
| Cooper Gary | $64,000 | -- | |
| Walston Randall L | $58,000 | -- | |
| Duer Julie | $7,000 | -- |
Source: Public Records
Mortgage History
| Date | Status | Borrower | Loan Amount |
|---|---|---|---|
| Closed | Cooper Gary | $51,200 | |
| Previous Owner | Walston Randall L | $57,850 |
Source: Public Records
Tax History Compared to Growth
Tax History
| Year | Tax Paid | Tax Assessment Tax Assessment Total Assessment is a certain percentage of the fair market value that is determined by local assessors to be the total taxable value of land and additions on the property. | Land | Improvement |
|---|---|---|---|---|
| 2025 | $989 | $125,700 | $0 | $0 |
| 2024 | $989 | $103,100 | $17,600 | $85,500 |
| 2023 | $996 | $100,767 | $0 | $0 |
| 2022 | $1,003 | $98,433 | $0 | $0 |
| 2021 | $982 | $96,100 | $17,600 | $78,500 |
| 2020 | $982 | $95,600 | $0 | $0 |
| 2019 | $954 | $95,100 | $0 | $0 |
| 2018 | $1,497 | $94,600 | $17,600 | $77,000 |
| 2017 | $1,451 | $87,933 | $0 | $0 |
| 2016 | $1,370 | $81,267 | $0 | $0 |
| 2015 | $1,370 | $74,600 | $0 | $0 |
| 2014 | $1,370 | $74,600 | $0 | $0 |
Source: Public Records
Map
Nearby Homes
- 152 Onley Rd
- 1165 S Division St
- 317 E College Ave
- 1026 Adams Ave Unit 3B
- 505 E College Ave
- 310 Princeton Ave
- 1022 Adams Ave Unit 2C
- 1010 Adams Ave Unit 2D
- 316 Pryor Ave
- 312 Pryor Ave
- 203 Shannon Ct
- 1315 Aspen Dr
- 1410 Limrock Ct
- 915 Green Mor Ave
- 530 E Lincoln Ave
- 1505 May Dr
- 806 Gettysburg Ave
- 104 Van Buren St
- 2 South Blvd
- 716 Edgar Dr